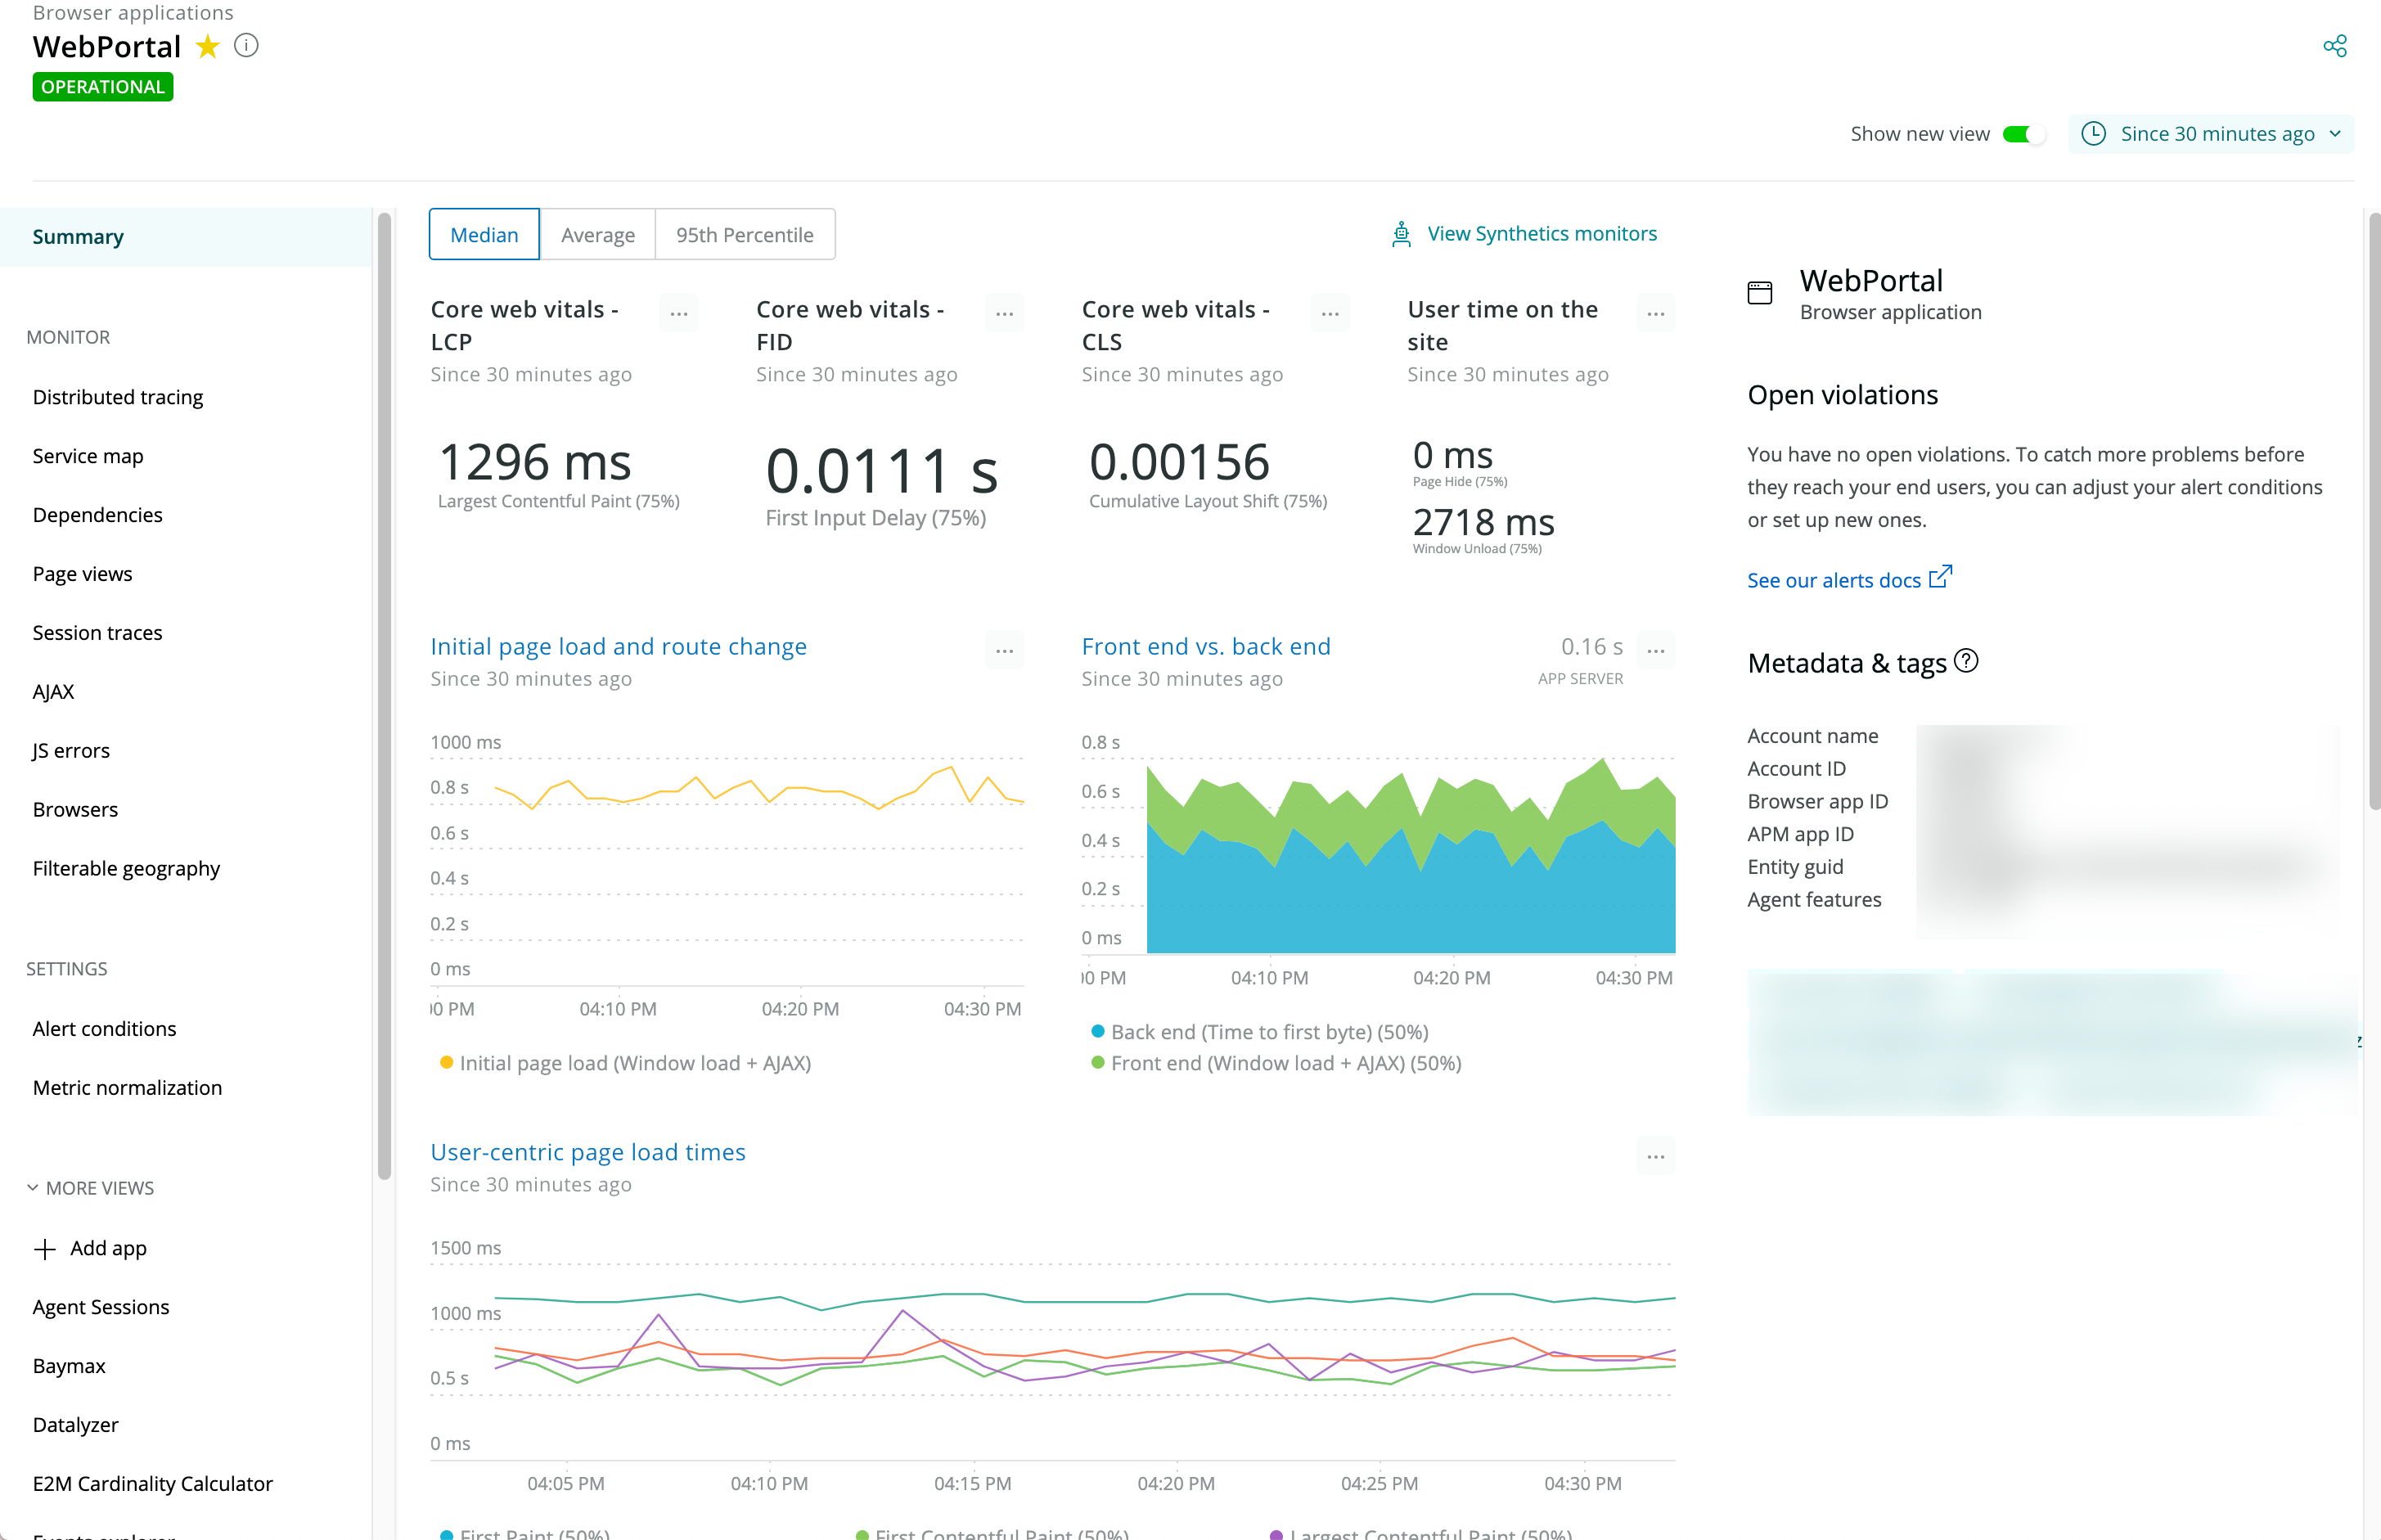
Your end-user experience depends on your entire technology stack. You need to quickly understand what's causing a customer complaint or issue.
- Did the problem come from your infrastructure, your application, or the browsers that ultimately render it?
- Is it the result of a problematic internet provider, a problem in your own data center with failing CPU or memory, or something else?
Tip
This doc gives you detailed information about why our browser monitoring solution matters to your business. But if you want to skip ahead, just sign up for a New Relic account. (It's free, forever!) Then, after you install the browser monitoring agent, you can start working with your data.
More than Real User Monitoring (RUM)
Many websites contain dynamic content that is loaded after the initial page has finished loading, and complex JavaScript code increases the need for error reporting. Browser monitoring in New Relic One provides a Real User Monitoring (RUM) solution that measures the speed and performance of your end users as they navigate to your site from different web browsers, devices, operating systems, and networks.

With browser monitoring in New Relic One, you see actionable data about your end users' experience with your app.
But browser monitoring in New Relic goes far beyond the initial page load to measure full page life cycle data. For example, our browser UI shows you:
- Actual performance data, such as by page view popularity and user satisfaction (Apdex) scores
- Perceived performance data that measures how quickly your async or dynamic visuals and interactive page contents display
- JavaScript error analytics, stack traces, and line-of-code visibility, to show you the end-user steps leading up to an error itself
- Session performance with a detailed timeline and heat map of the load and interaction events during a webpage's full life cycle
- AJAX requests indicating problems with timing, end points, and specific locations in the webpage
- Hash-based route changes in apps with single-page application (SPA) architectures
These tools (and more!) help your teams optimize your end users' page load experience, eliminate bugs, and troubleshoot faster across your full stack.
Examine user perceptions
Real user data gives insights into actual page performance, but you also need to look into your users' perception of your site's performance. Pages can load content in many different ways, and users control when they interact with that content. This is why some user-centric performance metrics happen outside the standard window onload (page load time) in the browser monitoring agent.
The PageViewTiming event provides a more real-time delivery mechanism that does not have a dependency on any other event. Additional metrics include:
- First paint, first contentful paint, and largest contentful paint
- First input delay
- First interaction
This helps you understand how users experience your site, both from visual and responsiveness standpoints.
Improve interactive app performance
Our single-page app (SPA) monitoring automatically tracks route changes, initial page loads, and synchronous and asynchronous activity during browser interactions. You can also use our browser agent and SPA API to monitor virtually anything that executes inside the browser.
If you are a developer, SPA monitoring can help you:
- Create faster, more responsive, highly interactive apps.
- Monitor the throughput and performance that real users are experiencing.
- Troubleshoot and resolve problems within the context of the page load.
- Query and visualize the data to assist with business decisions.
- Bring better apps to the marketplace more quickly.
Correlate front-end and back-end problems
With New Relic One, you can instrument any type of data you need, such as metrics, events, logs, and traces. This helps you find actionable data about your end users' experience across the stack. For example:
Type of data | Comments |
|---|---|
Locations or domains | Limit browser monitoring to focus on specific geographical locations or specific types of end-user activity. You can also monitor or block specific domains. |
Trends in interactions | Use our comparative charting feature for a direct page load time comparison between real user (browser) interactions and trends appearing in Synthetic monitors. |
Distributed tracing | Isolate latency from the web browser through back-end services with distributed tracing. The UI helps you see the connection across across a full transaction, from browser activity, to time spent in network, to back-end activity. |
Browser types | Explore your end users' experience with your app segmented by any types of browsers they use, including:
|
Get started with browser monitoring
Follow these basic steps, and you'll quickly be up and running in New Relic with browser monitoring!
- Review the compatibility details and basic requirements for browser monitoring.
- Install the browser agent.
- Go to [one.newrelic.com > Explorer > Browser applications. Use the Explorer to access all your entities, that is, anything we can identify that reports data, from applications and hosts to custom groupings of any elements.
- View summary data from your Browser summary page, then drill down into page load timing details and other UI data.
- Configure your alerts for key performance data, or use our applied intelligence solutions to reduce alert noise, correlate incidents, and automatically detect anomalies.
- Query and visualize your default data (or customize your own), then analyze what that data says about your business.
- Customize and share your own charts and dashboards.