After you set up your network data for performance monitoring, you can go to New Relic One and install several custom-curated visualizations designed specifically for network performance monitoring. Then, after you set up these visualizations, you can start exploring the network data your devices are reporting to New Relic One.
You can group and monitor your switches, routers, etc. in dashboards. This helps you quickly aggregate, isolate, and analyze the health of your network. For some examples of monitoring your network in New Relic One, watch this short video (approx. 3:45 minutes).
Prerequisites
- A New Relic account. Don't have one? Sign up for free! No credit card required.
- Having set up your network performance monitoring devices. Read how to:
- Add the custom visualizations app to your account:
- Go to one.newrelic.com > Apps, and search for Network Agent Visualizations.
- Click the app, and then click Open visualization.
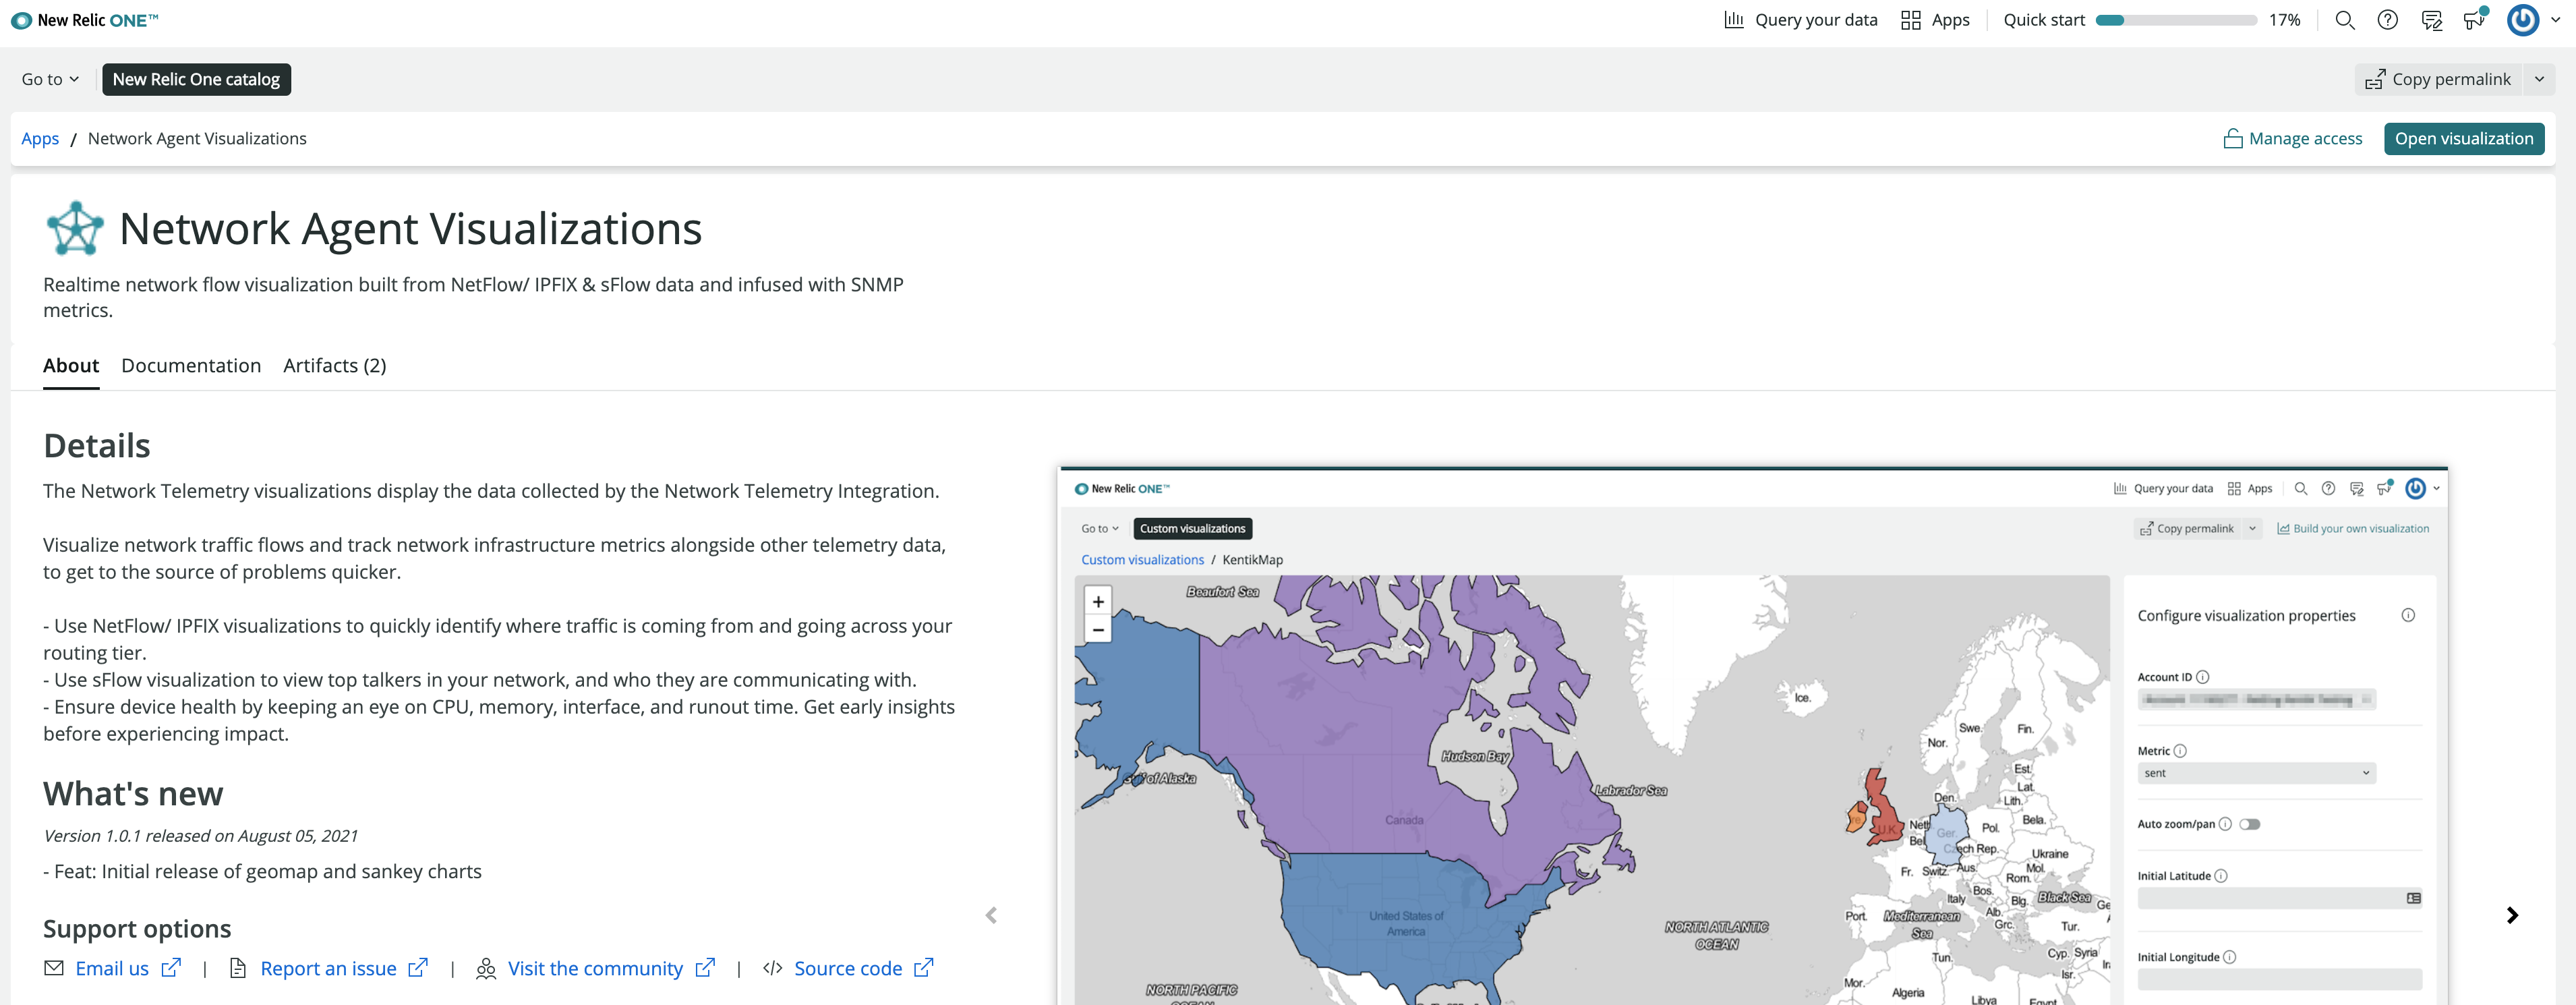
one.newrelic.com > Apps, and search for Network Agent Visualizations. - From the Account ID dropdown, select the account you want to add the visualizations to, and click Enable.
Add the Network dashboards to your account
You can go to New Relic One and import several dashboards to see curated views of your network telemetry, including the GeoMap and Sankey custom visualizations from the prerequisites.
- Go to Instant observability and search for npm.
- Click one of the dashboards:
- Use the Network Data Ingest and Cardinality dashboard to analyze usage trends.
- Use the Network Flow Devices dashboard for network flow data.
- Use the Network Routers and Switches dashboard for SNMP data from router and switch entities.
- Use the Network Syslog dashboard to get insights inti potential issues and changes within your network.
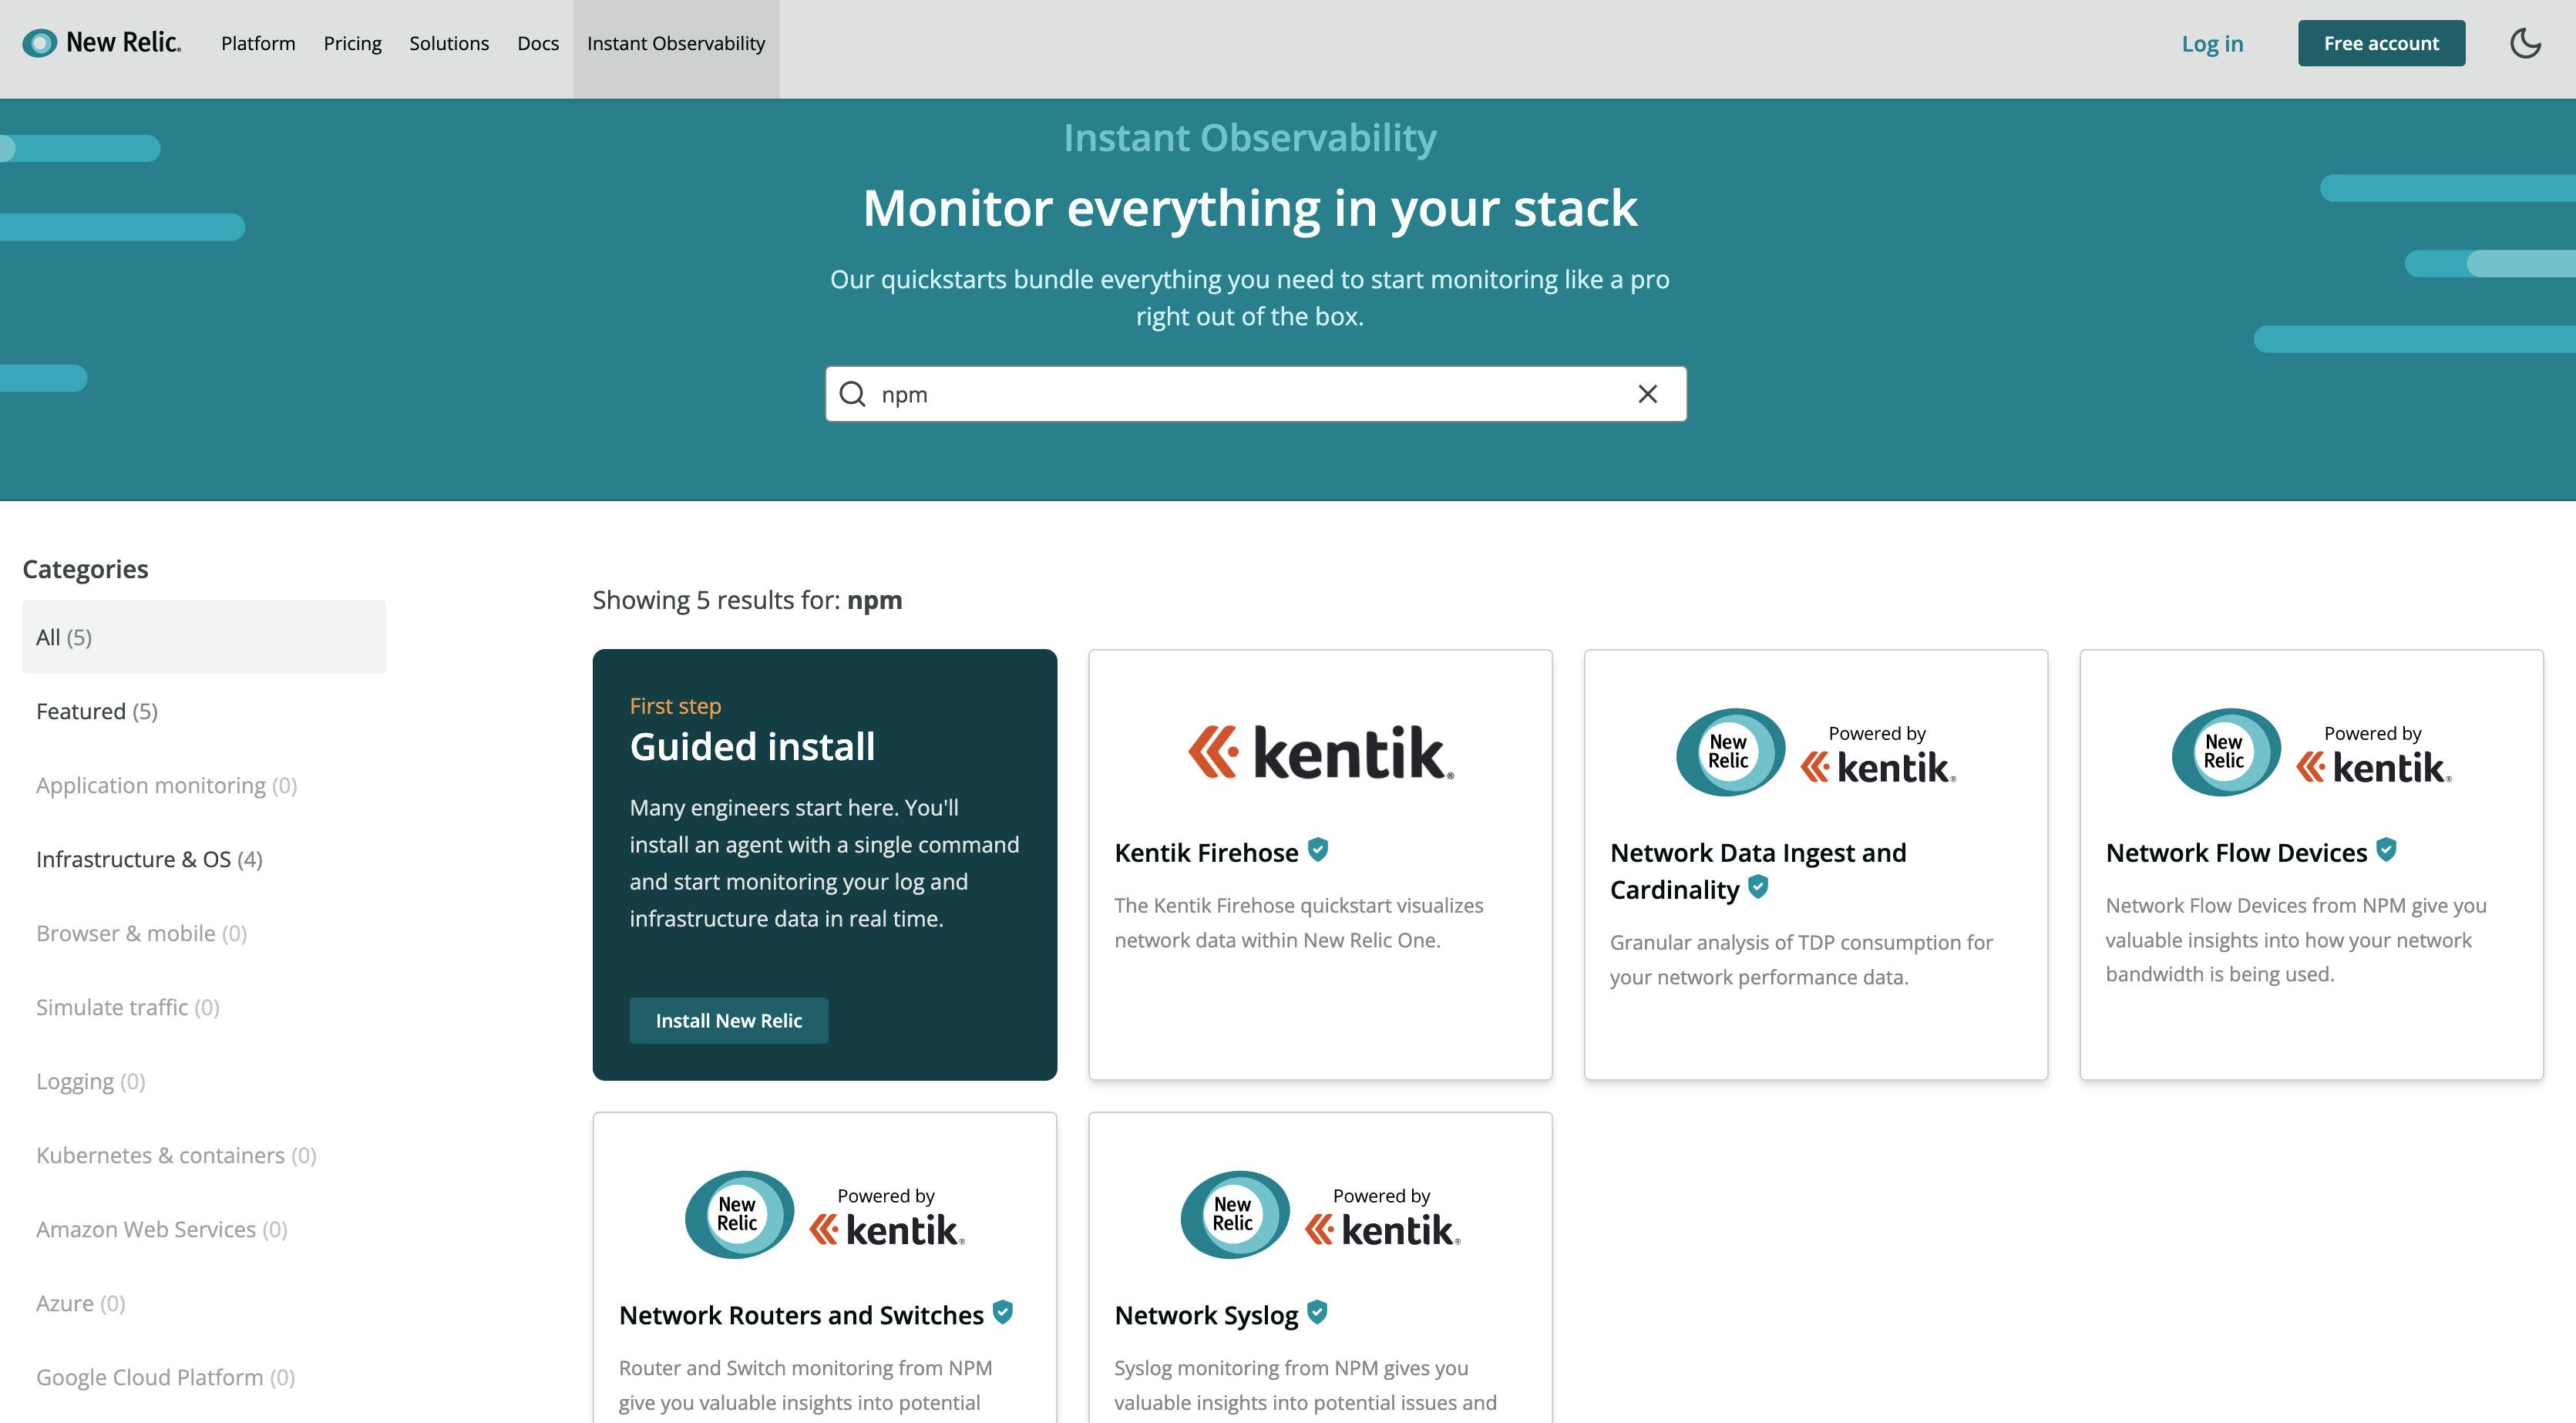
Instant observability and search for npm.
- Click Install quickstart. You'll be redirected to one.newrelic.com.
- Select the account where you want to add the dashboard, and click Begin installation. Follow the instructions within one.newrelic.com.
Tip
If you want to read more about custom visualizations in New Relic One, see the introduction to custom visualizations.
Start exploring your network performance data
Once you've finished setting up these dashboards, you can start seeing your network data by going to Dashboards or Explorer in New Relic One:
From one.newrelic.com > Dashboards:
For usage trend analysis, you'll see the following dashboard:
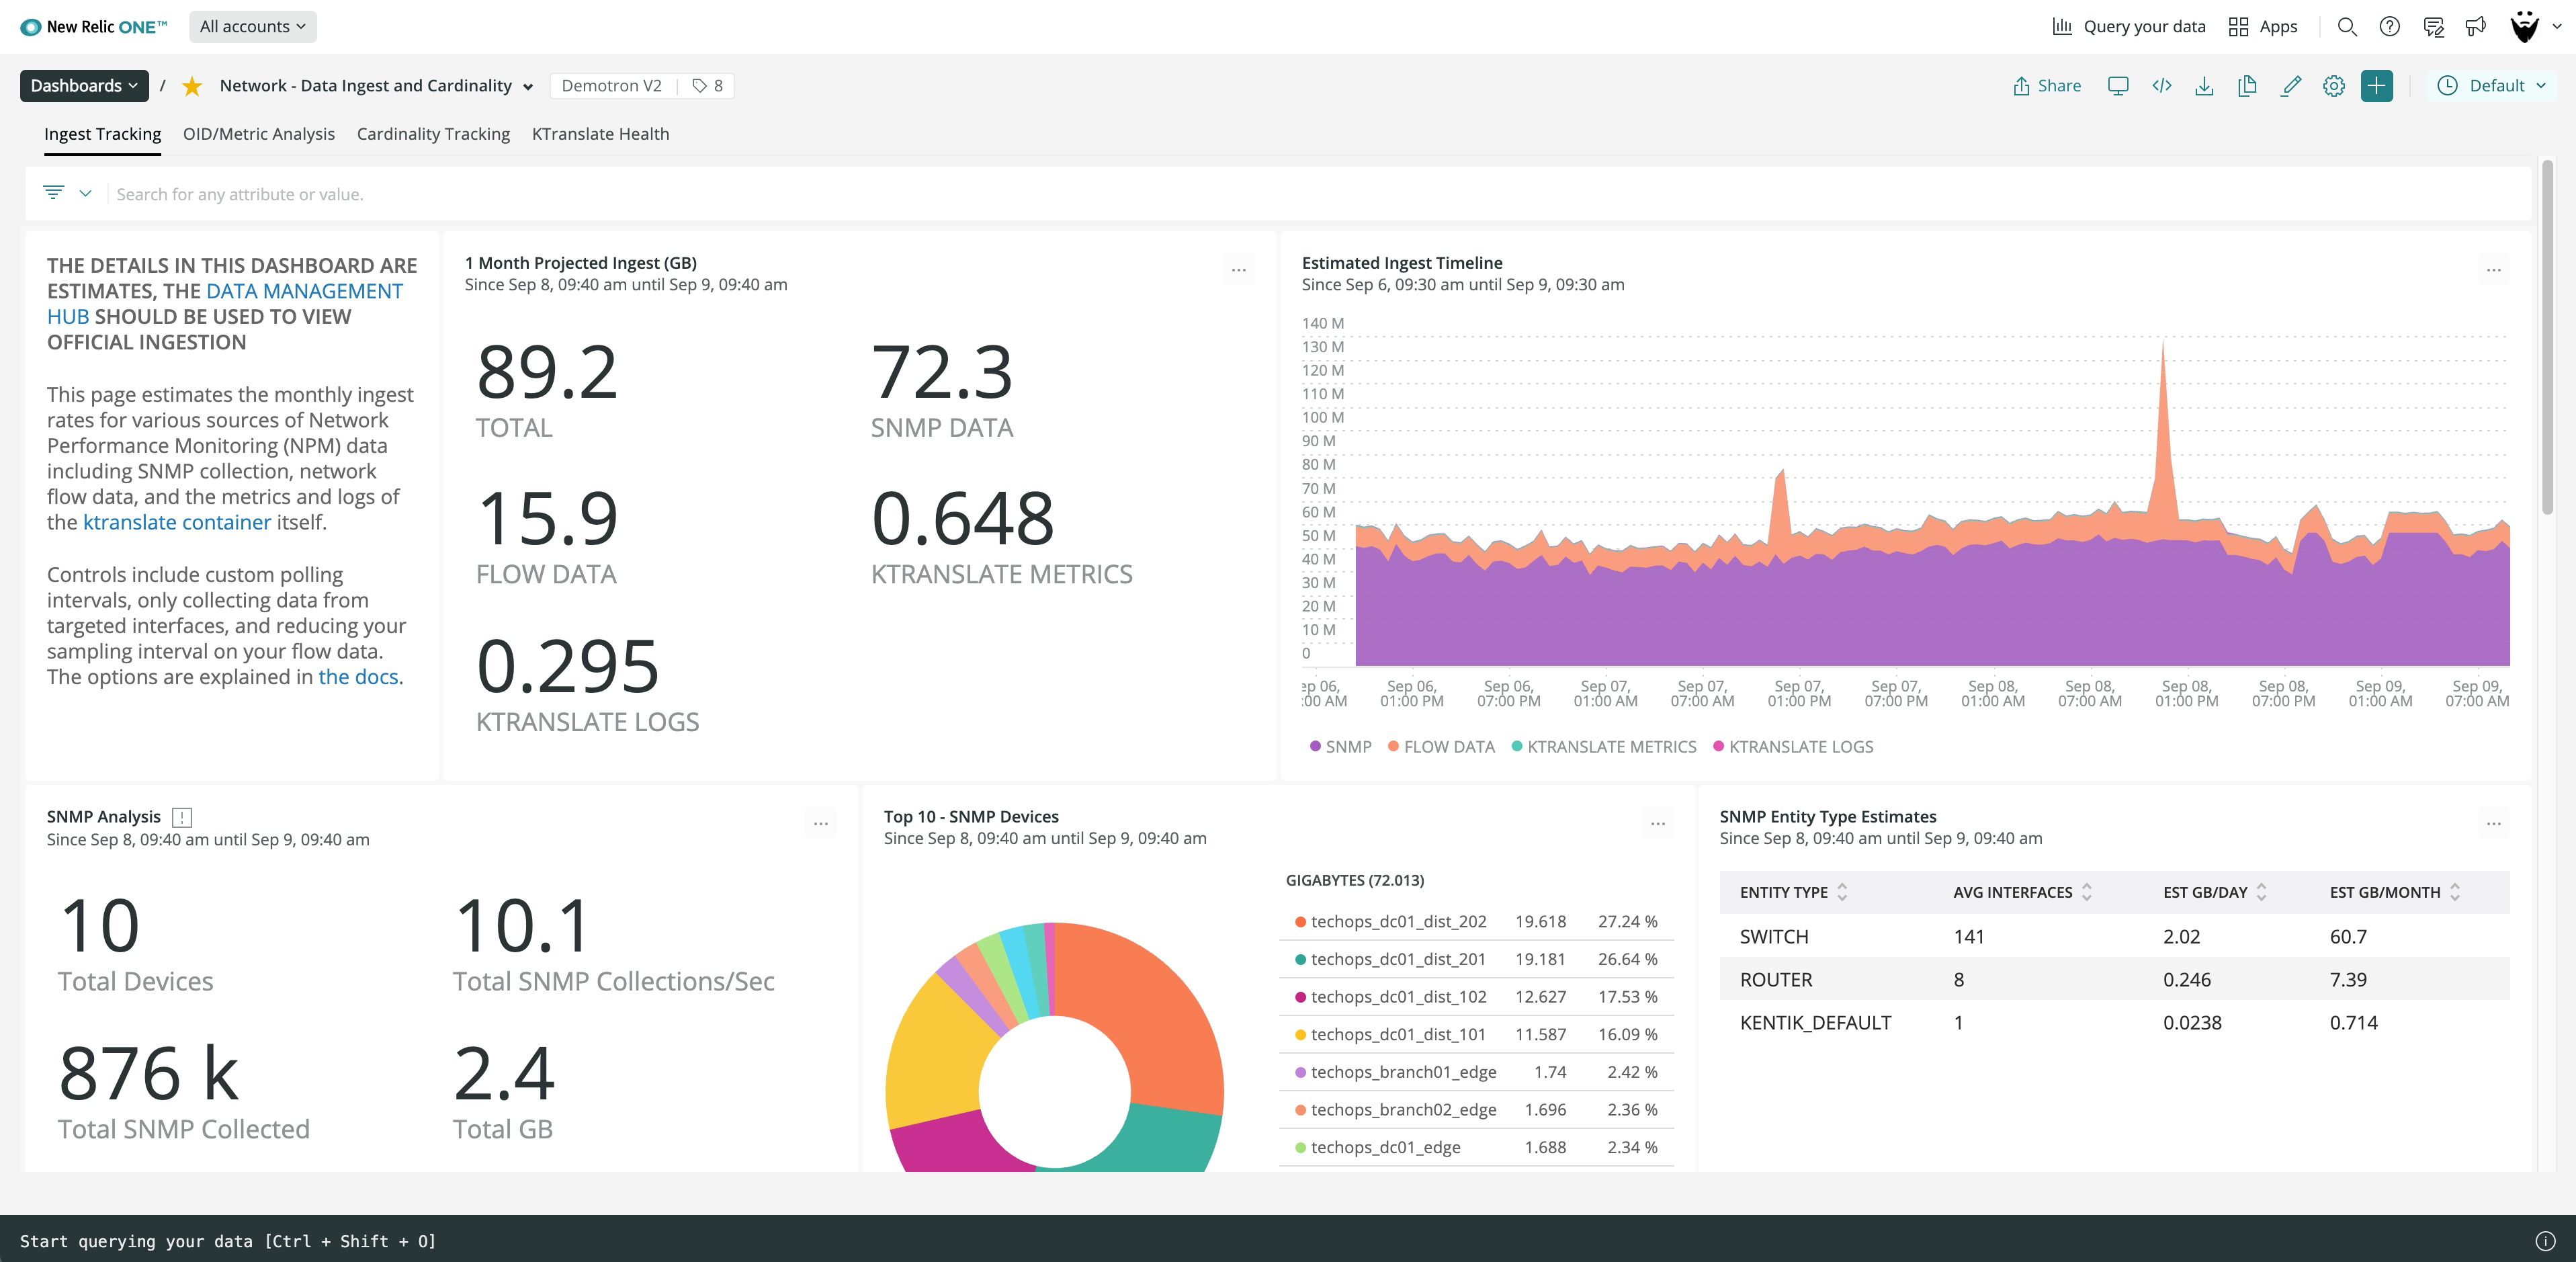
Dashboard for analyzing network telemetry usage trends in New Relic One.
For SNMP data, you'll see the following dashboard:
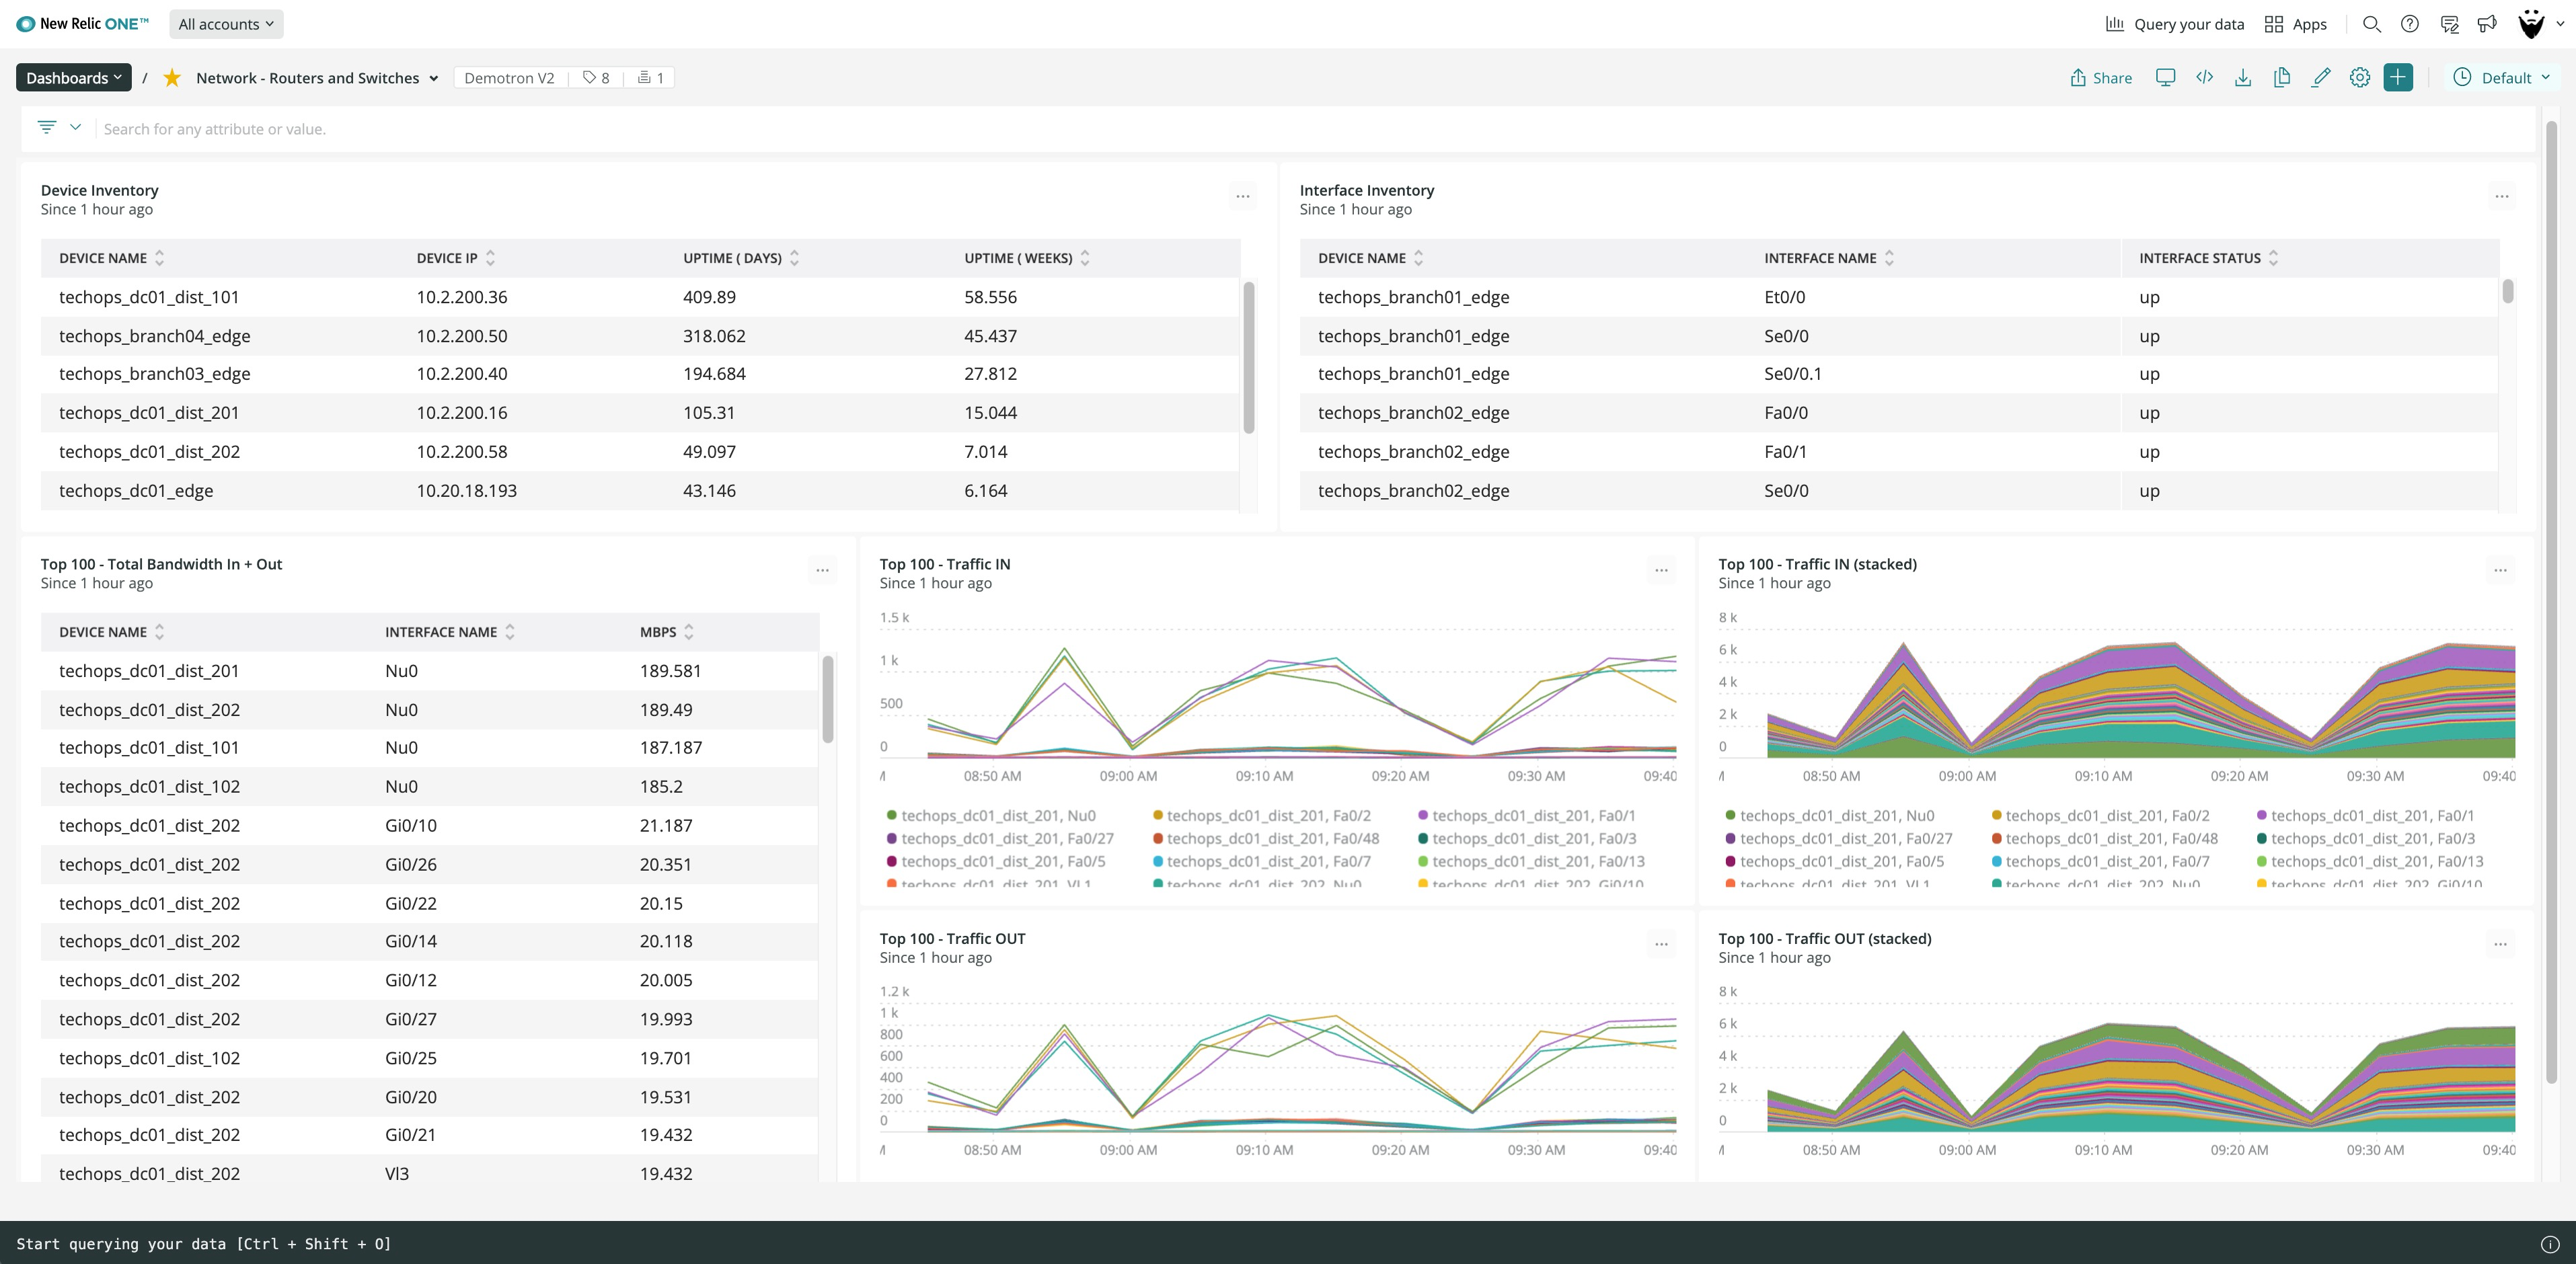
Dashboard for SNMP data from router and switch entities in New Relic One.
For network flow data, you'll see the following dashboard:
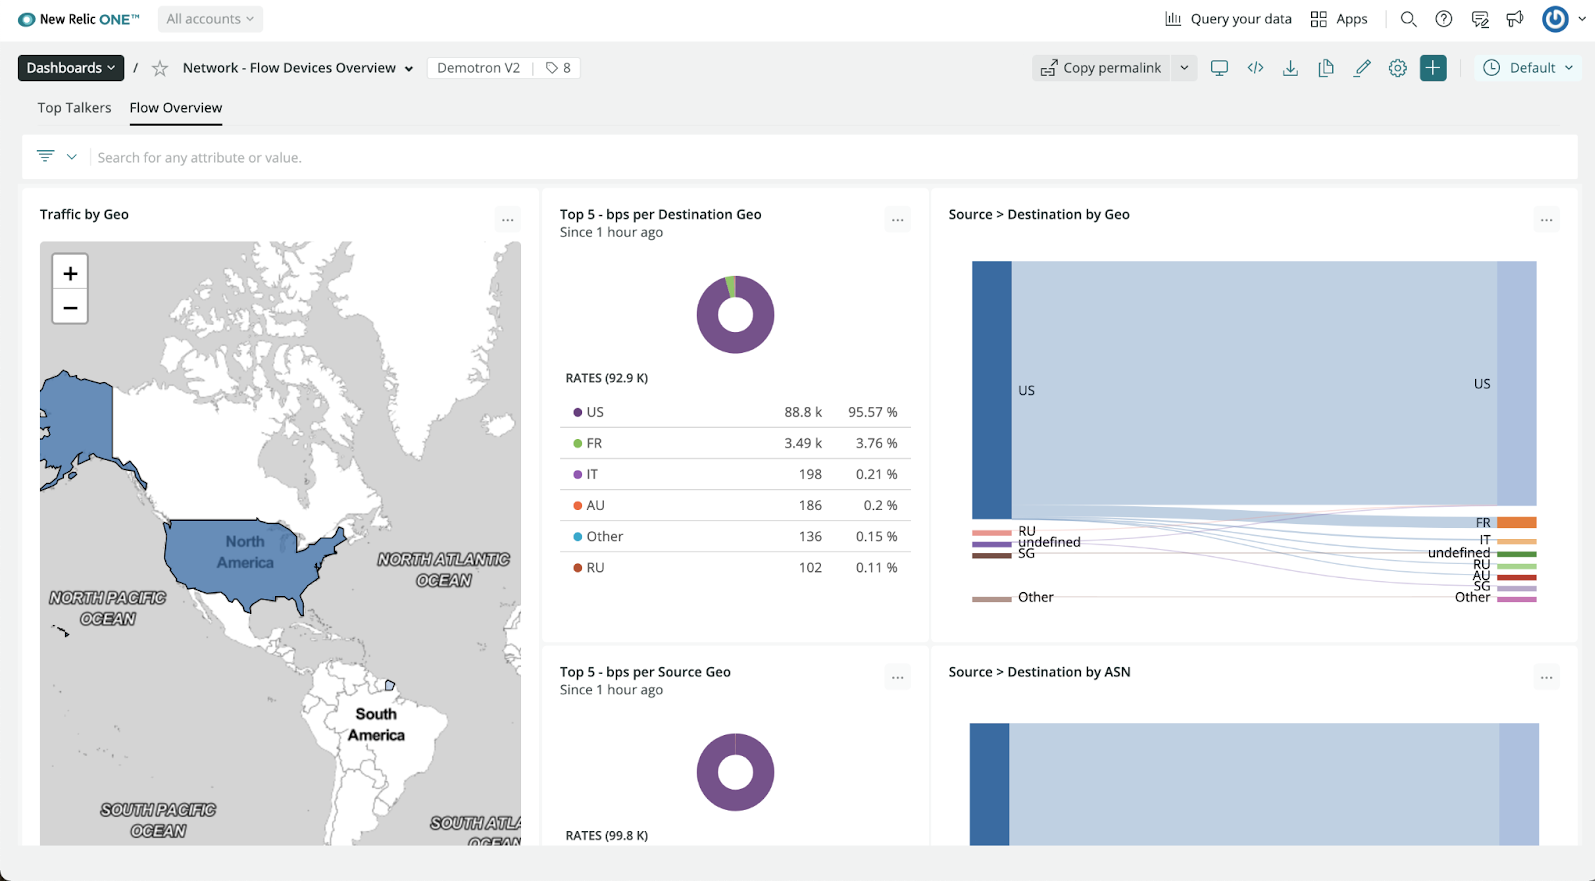
Dashboard for network flow data monitoring in New Relic One.
From one.newrelic.com > Explorer:
Entities are listed under the Network category in the left-hand side menu.
- Open a specific device to see the details and trend of its performance.
- On the top right-hand side, click Lookout to see anomalies.
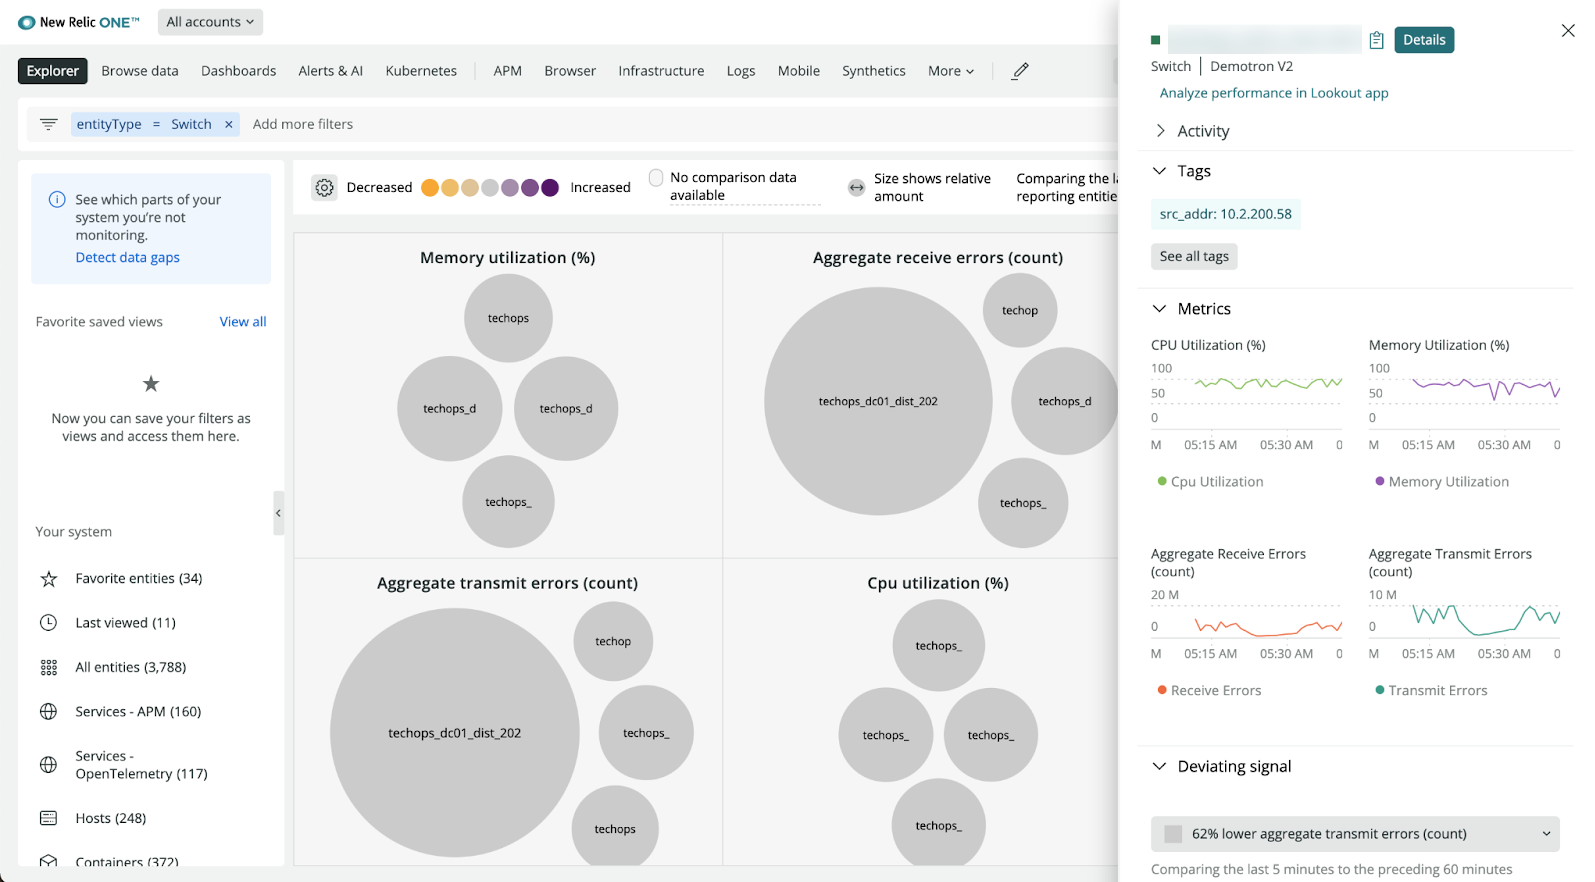
Lookout view for network performance monitoring in New Relic One.
To learn how to troubleshoot network data in Navigator and Lookout, watch this short video (approx. 3:15 minutes).