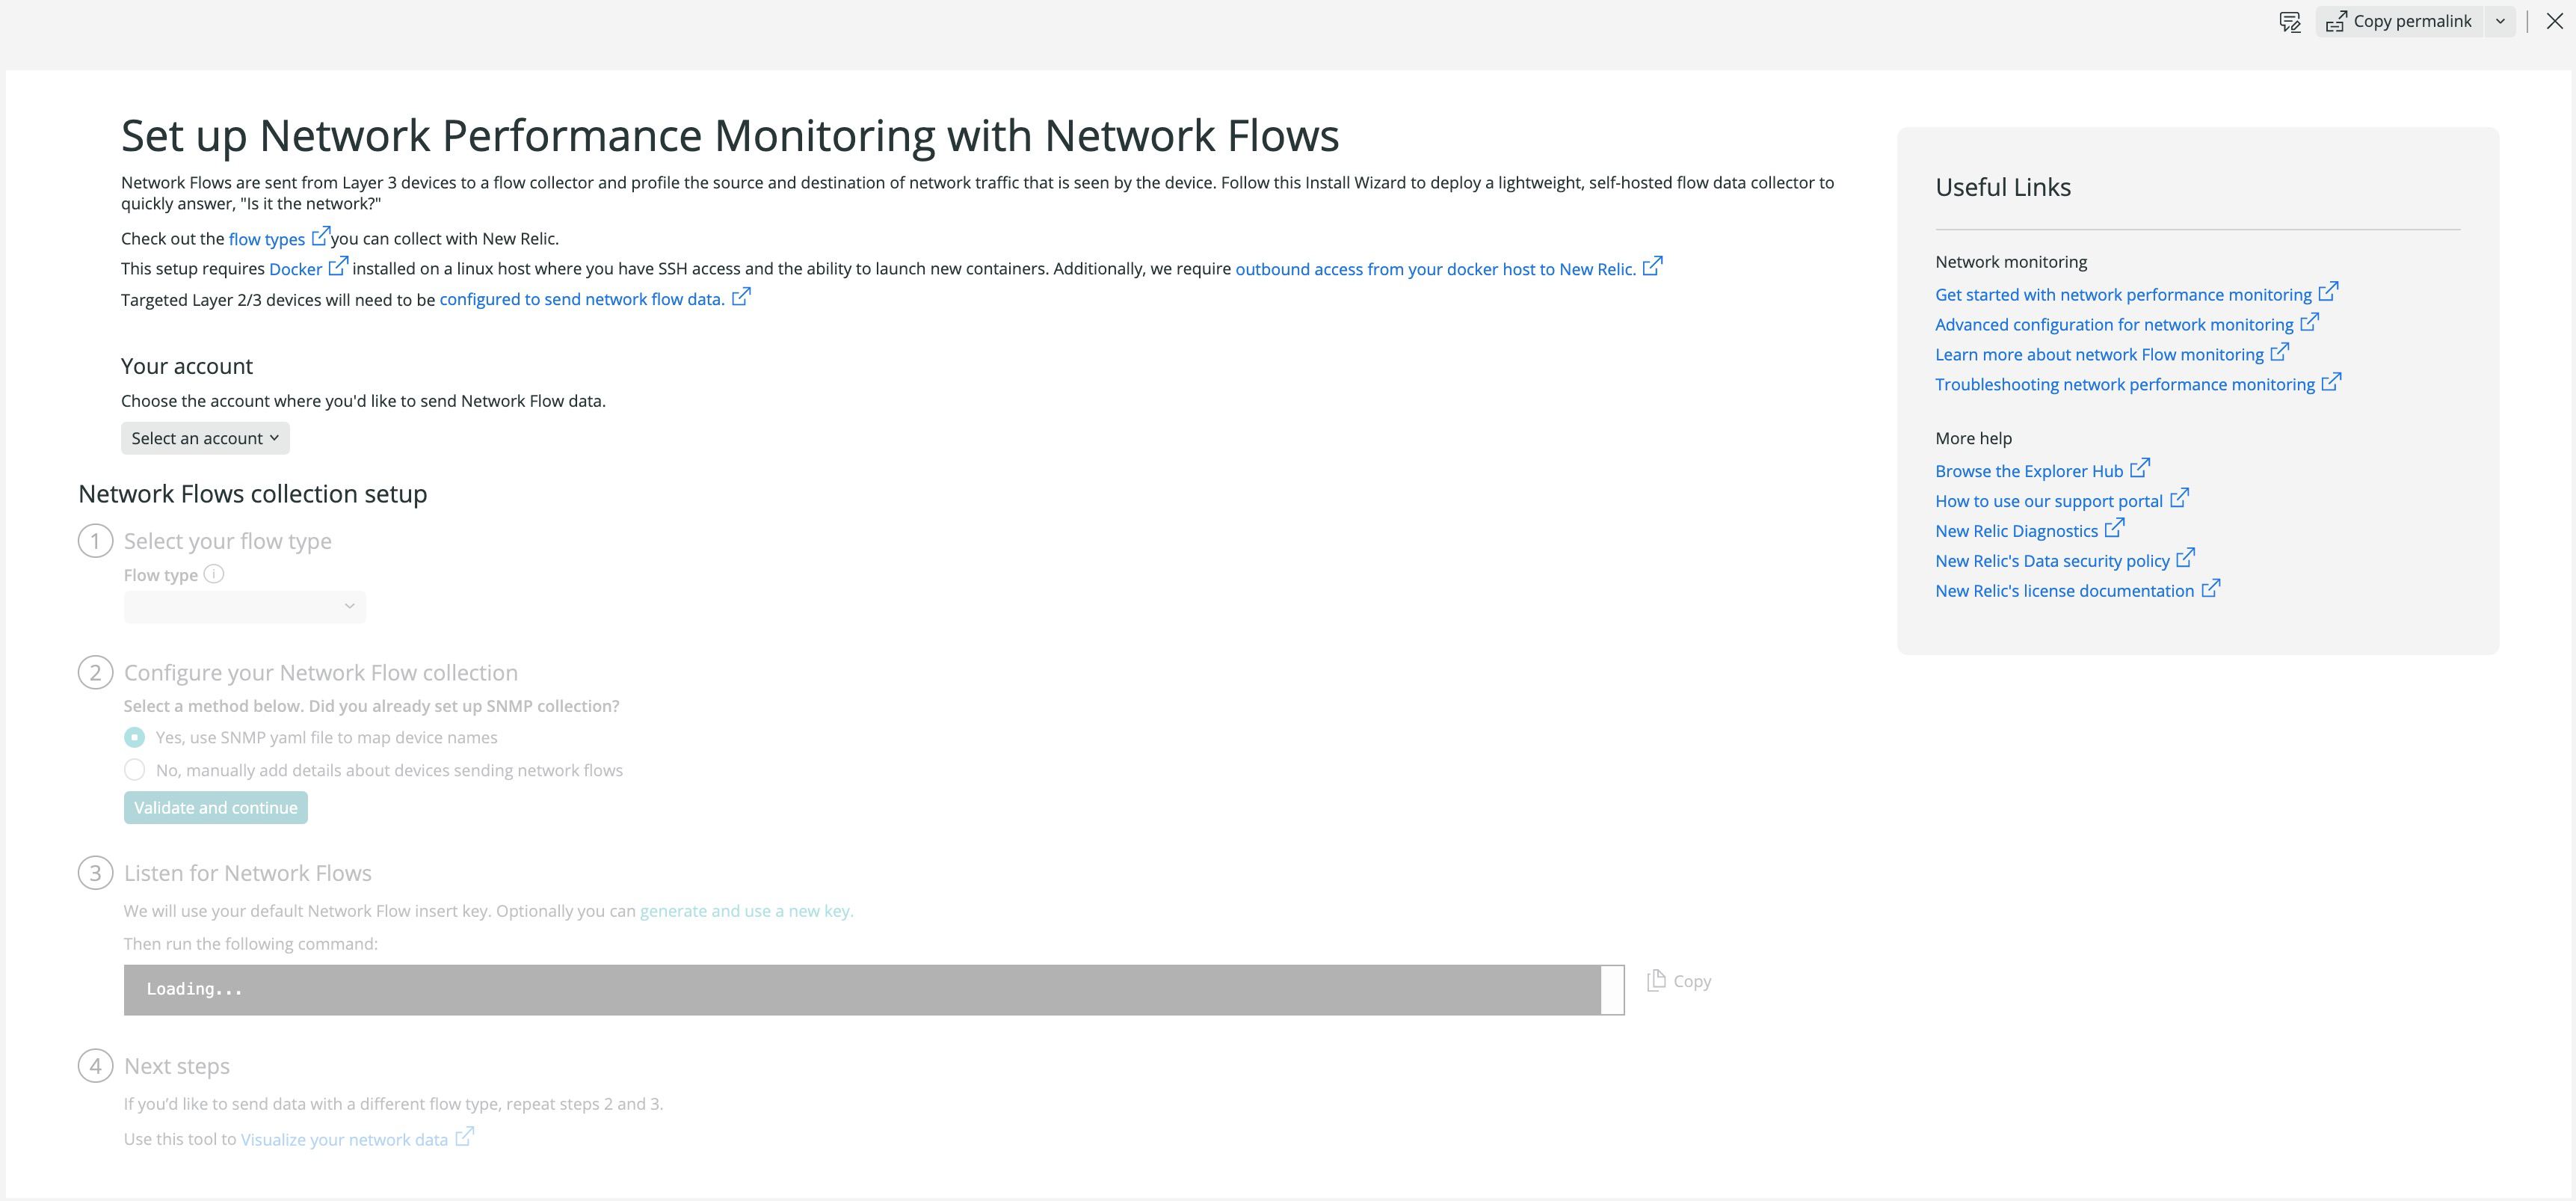
Set up your network devices so they send network data to New Relic One.
Prerequisites and supported types of network flow data
Scaling network flow collection
When planning your strategy for collecting network flows at scale, New Relic recommends 1 CPU per 2000 flows-per-second (120,000 flows-per-minute). Deciding whether to run more small containers to distribute load or fewer large containers to consolidate management is a matter of personal preference.
Set up network flow data monitoring in New Relic One
- Go to one.newrelic.com and click Add more data.
- Scroll down until you see Network performance monitoring and click Network Flows.
- Follow the steps in New Relic One.

one.newrelic.com > Add more data > Network performance monitoring > Network Flows to set up network flow data monitoring. - To get better visibility into your network device performance, set up SNMP data monitoring.
- Visualize your network performance data in New Relic.
Find and use your metrics
All network flow logs exported from the ktranslate container use the KFlow namespace, via the New Relic Event API. Currently, these are the default fields populated from this integration:
Attribute | Type | Description |
|---|---|---|
| String | The class of program generating the traffic in this flow record. This is derived from the lowest numeric value from |
| String | The display name of the sampling device for this flow record. |
| String | The target IP address for this flow record. |
| Numeric | The target Autonomous System Number for this flow record. |
| String | The target Autonomous System Name for this flow record. |
| String | The target |
| String | The target country for this flow record, if known. |
| Numeric | The number of bytes transferred for ingress flow records. |
| Numeric | The number of packets transferred for ingress flow records. |
| Numeric |
|
| Numeric | The target port for this flow record. |
| Numeric | The source port for this flow record. |
| Numeric |
|
| String | The display name of the protocol used in this flow record, derived from the numeric IANA protocol number. |
| String | This attribute is used to uniquely identify various sources of data from |
| Numeric | Sampling rate applied by either the sampling device configuration, or the |
| String | The source IP address for this flow record. |
| Numeric | The source Autonomous System Number for this flow record. |
| String | The source Autonomous System Name for this flow record. |
| String | The source |
| String | The source country for this flow record, if known. |
| Numeric | TCP flags in this flow record. |
| Numeric | The time, in Unix seconds, when this flow record was received by the New Relic Event API. |