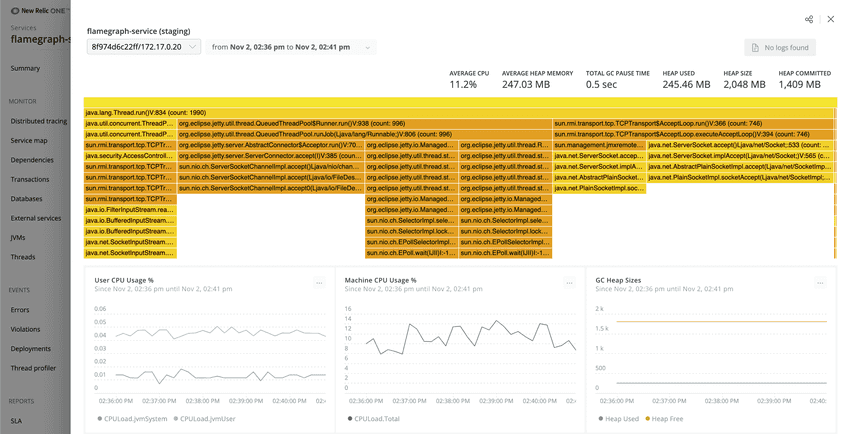
New Relic's real-time profiling for Java using Java Flight Recorder (JFR) metrics allows you to run continuous, always-on profiling of your Java code in production environments. Previously, this feature had to be manually enabled to use. Now, real-time profiling for Java will be on by default for anyone who installs the Java Agent for the first time or downloads the latest release (v7.1). In addition to the Flamegraph feature, this change makes it easier for Java Agent users to quickly identify what happened during an incident and what performance issues led up to it. Learn more about real-time profiling for Java in our blog post or watch the demo.
FAQ
- Will this impact my data ingest amount? Yes, if you don’t already use real-time profiling for Java, then you will see an increase in data ingested.
- How do I turn off real-time profiling for Java? If you don’t want to use this feature, you can disable it by setting the enabled flag to false.
