APM logs in context connects your logs with all of your telemetry data for your apps, hosts, and other entities. Bringing all of this data together in a single tool helps you quickly:
- Cut through the noise of thousands of logs when troubleshooting time-critical issues, so you automatically see only the most relevant logs.
- Navigate within multiple types of telemetry data, and have the data correlate back to the original issue.
- Easily drill down into more detailed information from the same place in the UI.
- Find the log lines that you need to identify and resolve a problem.
For more information, including examples, learn how to get started with APM logs in context.
Automatic logs in context options
You have three options to configure APM logs in context to send your app's logs and linking metadata automatically to New Relic.
Secure your data
Your logs may include sensitive information protected by HIPAA or other compliance protocols. By default we obfuscate number patterns that appear to be for items such as credit cards or Social Security numbers, but you may need to hash or mask additional information.
For more information, see our documentation about obfuscation expressions and rules. You can hash or mask your log data by using the New Relic UI or by using NerdGraph, our GraphQL API.
Explore your data
To make the most of your logging data:
- On the APM Summary page, click your Web transaction time chart to view logs associated with a specific point in time.
- Check your app's Errors inbox to view the logs associated with your errors.
- Use distributed tracing to see the logs associated with individual traces.
- Explore more logging data across your platform with our Logs UI.
- Set up alerts based on log output and severity.
- Query your data using our specialized UI for logs data, and create dashboards with the results.
Troubleshooting tips
Typically your logs will start to appear less than a minute after you enable APM logs in context. Check your app's Triage > Logs section. You will also start seeing log patterns related to the error there.
If you don't see any logs for errors or traces, there may not be any for your app. Try refreshing the UI page, or change the selected time period.
Disable automatic logging
APM logs in context automatically forwards APM agent log data and is enabled by default. This can have a negative impact on your security, compliance, billing, or system performance. For more information, or if you need to adjust the default setting, follow the procedures to disable automatic logging.
Manual logs in context option
If you need to use the manual process to set up logs in context for .NET, follow these steps:
- Make sure you have already set up logging in New Relic. This includes configuring a supported log forwarder that collects your application logs and extends the metadata that is forwarded to New Relic.
- Install or update to the latest .NET agent version, and enable distributed tracing. Use .NET agent version 8.21 or higher and the New Relic .NET agent API version 8.21 or higher for logs in context.
- Install or update to Microsoft .NET Framework 4.5 or higher or .NET Core 2.0 or higher.
- Install and configure any of the following logging extensions to enrich your log data, including:
- Check your log data in the New Relic UI.
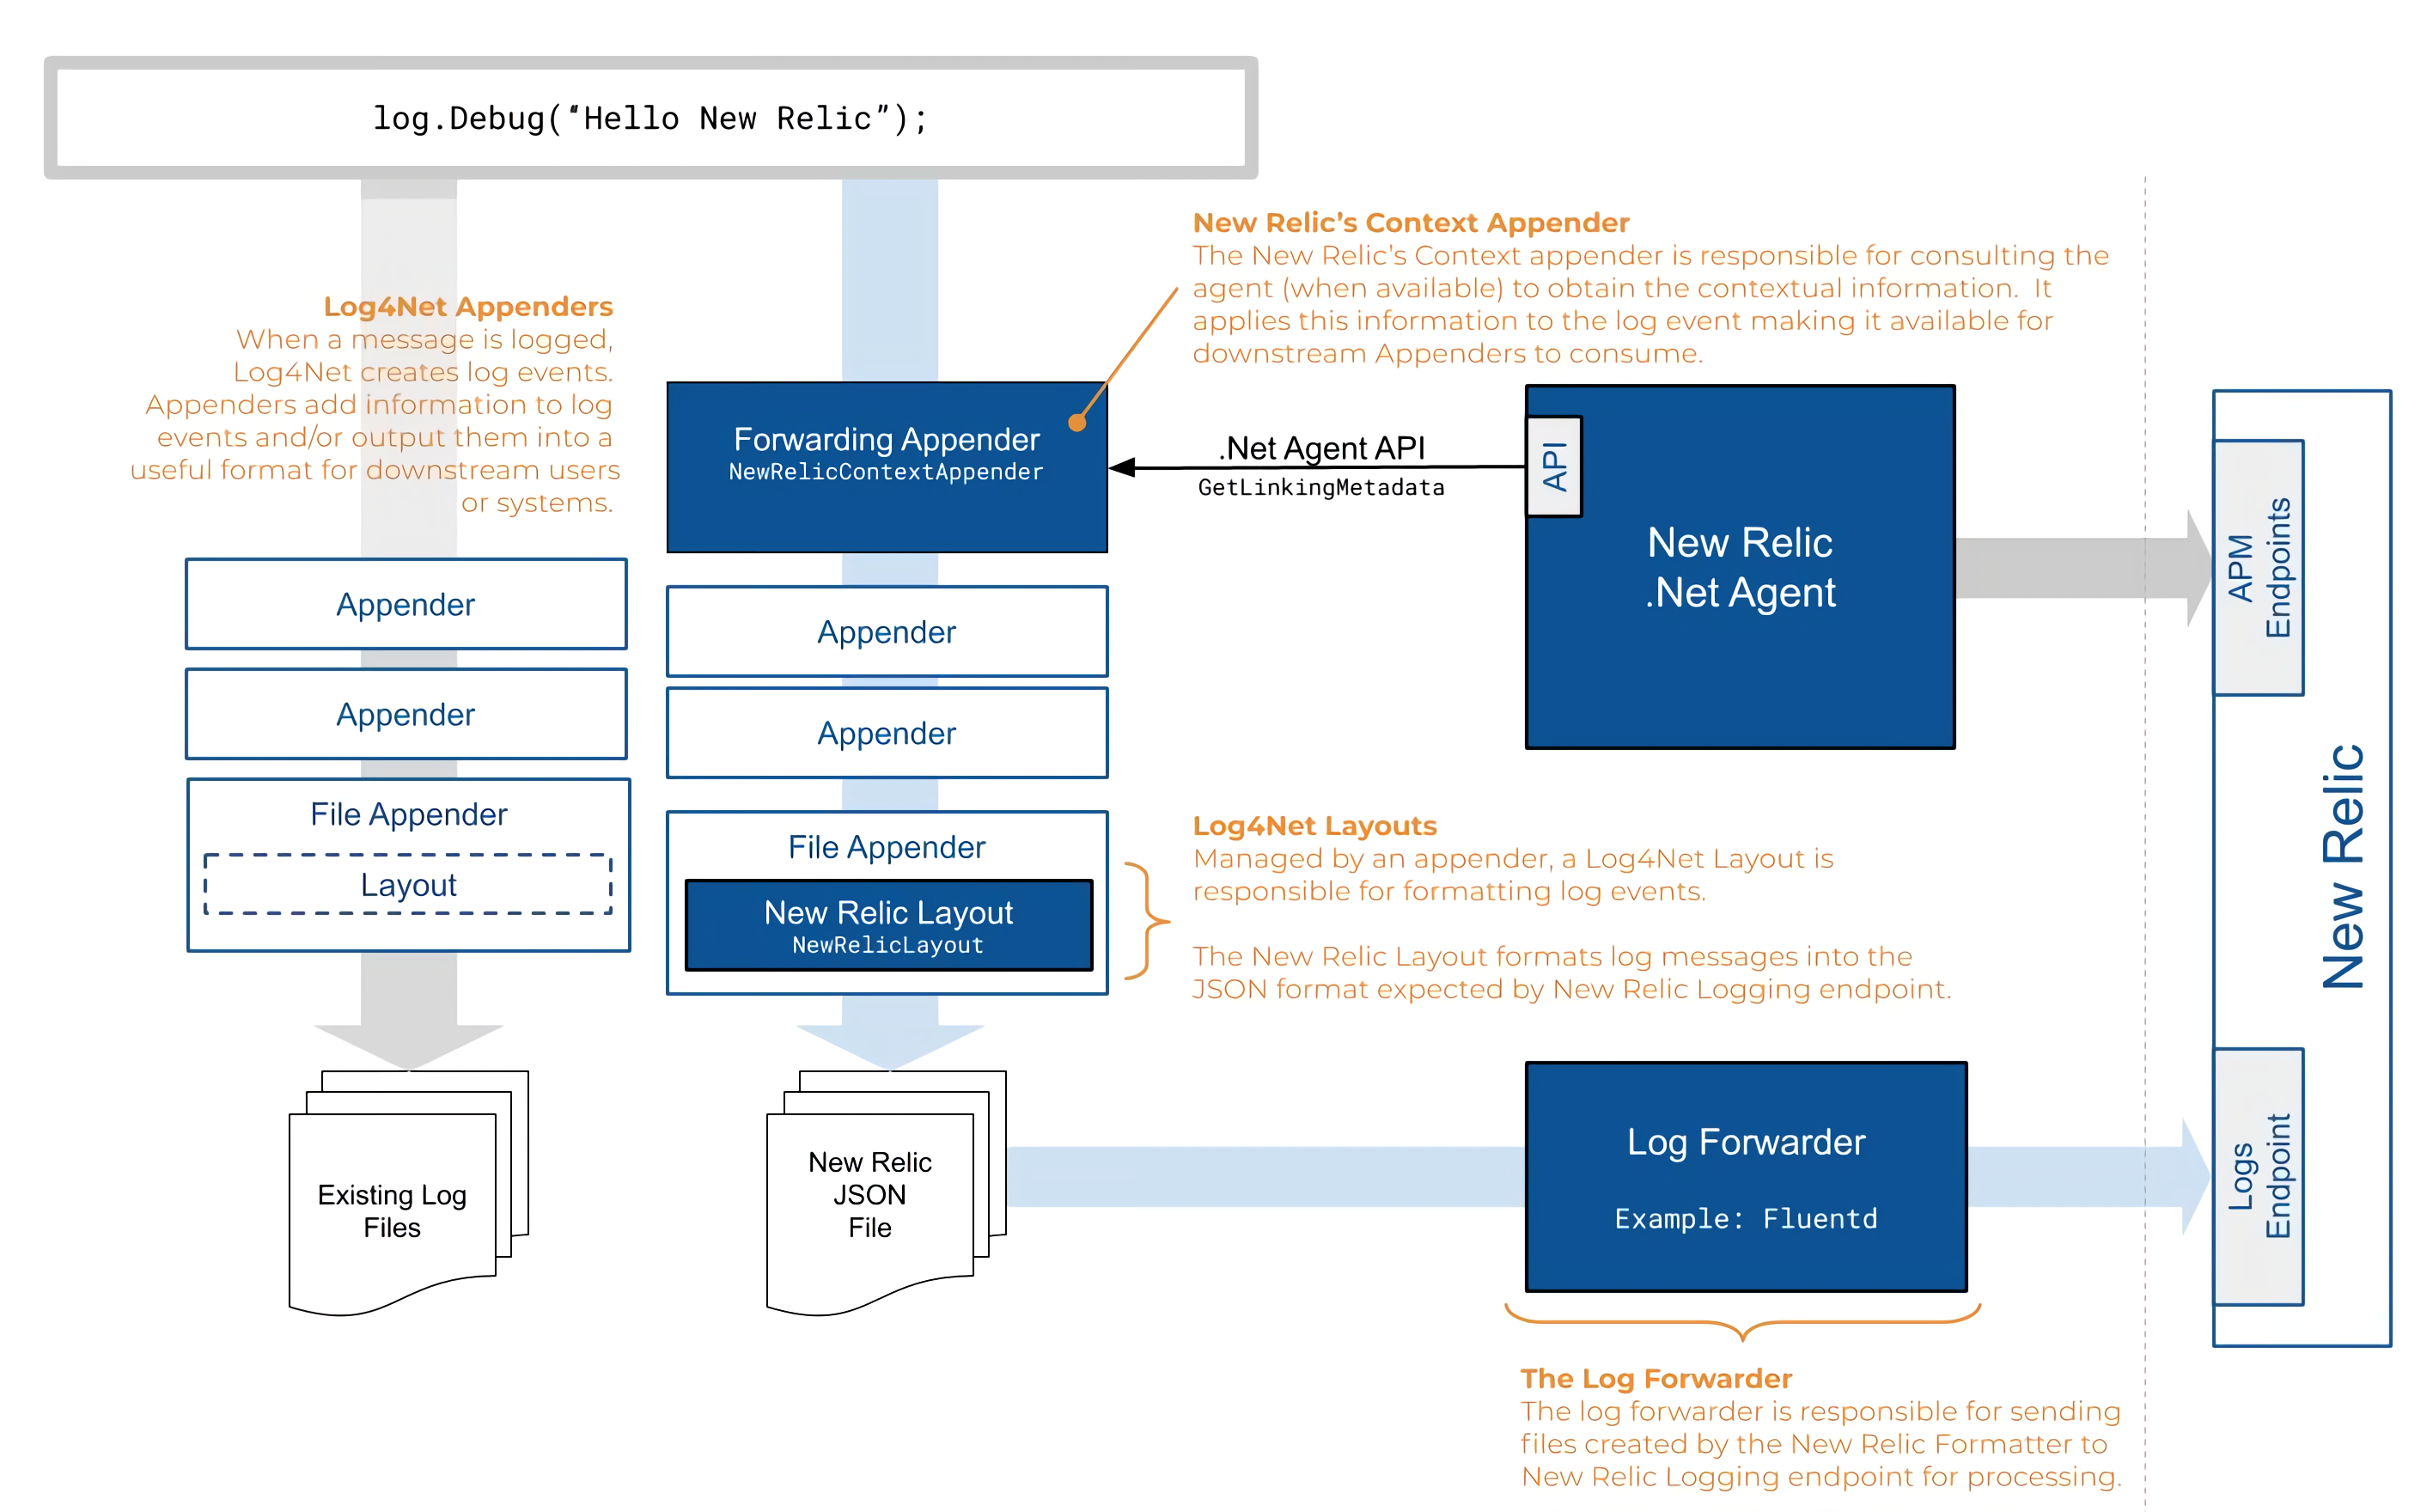
Configure log4net extension
You can use the Apache log4net version 2.0.8 or higher extension to link your log data with related data across the rest of the New Relic platform.
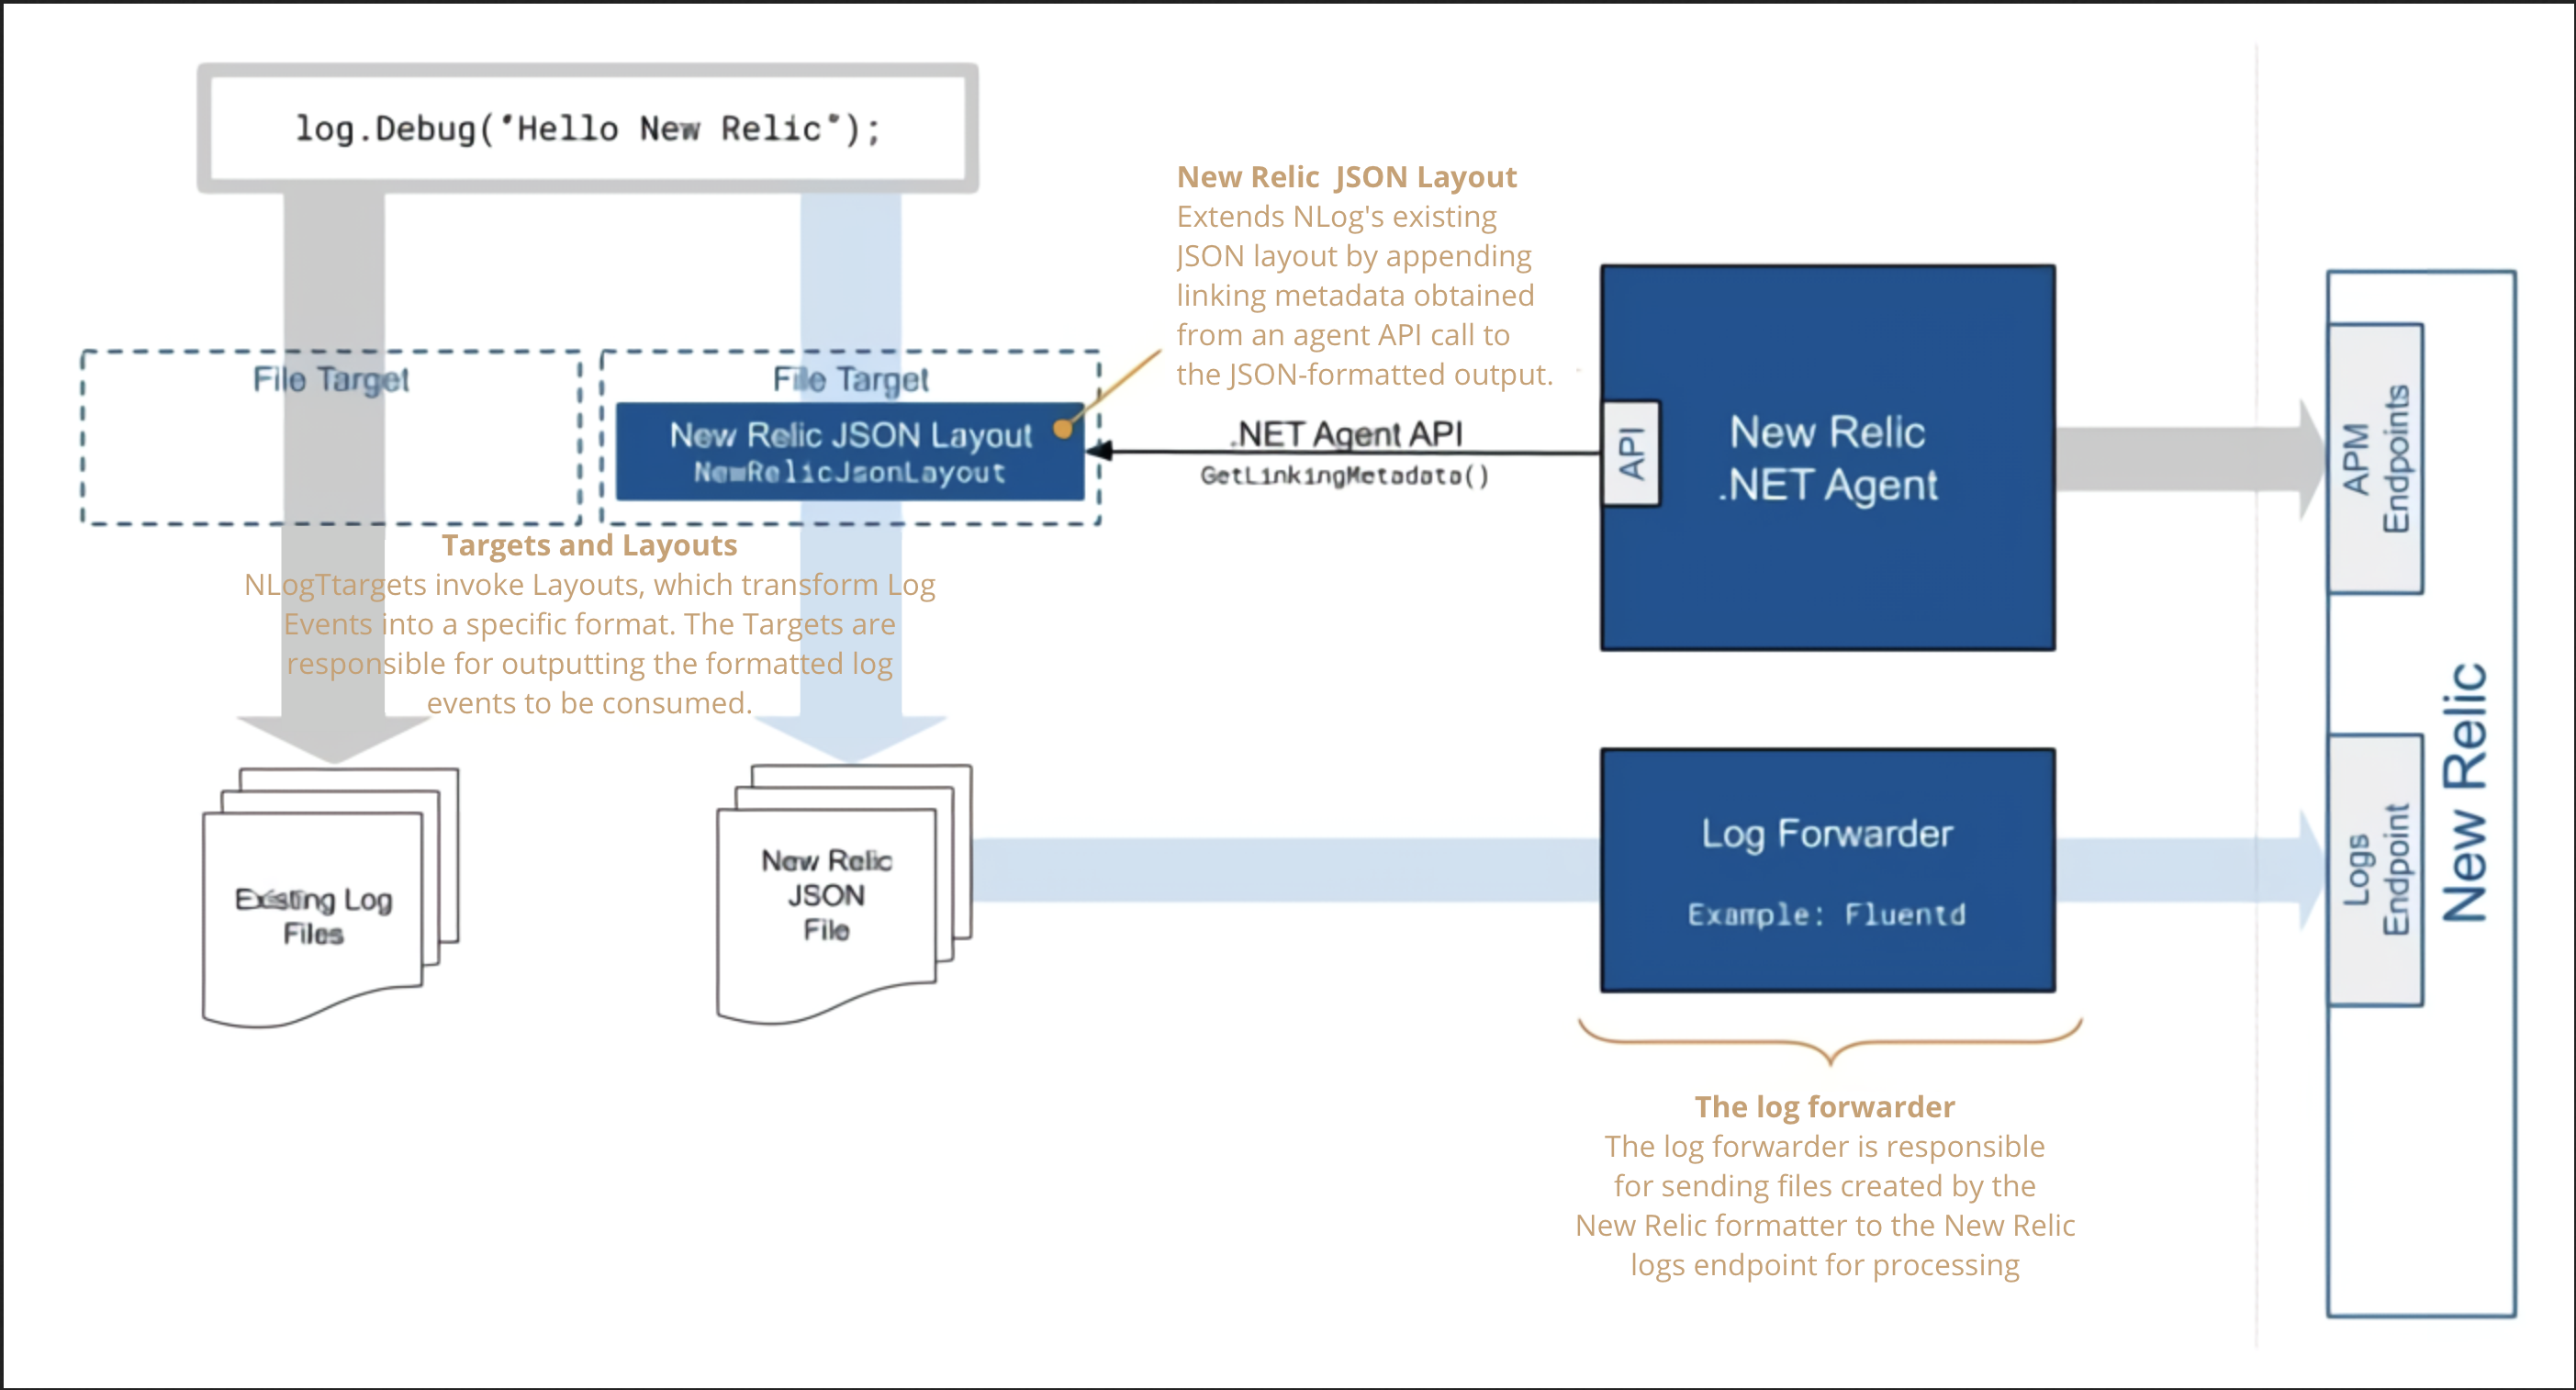
Configure NLog extension
You can use our NLog 4.5 or higher extension to link to your log data with related data across the rest of the New Relic platform.
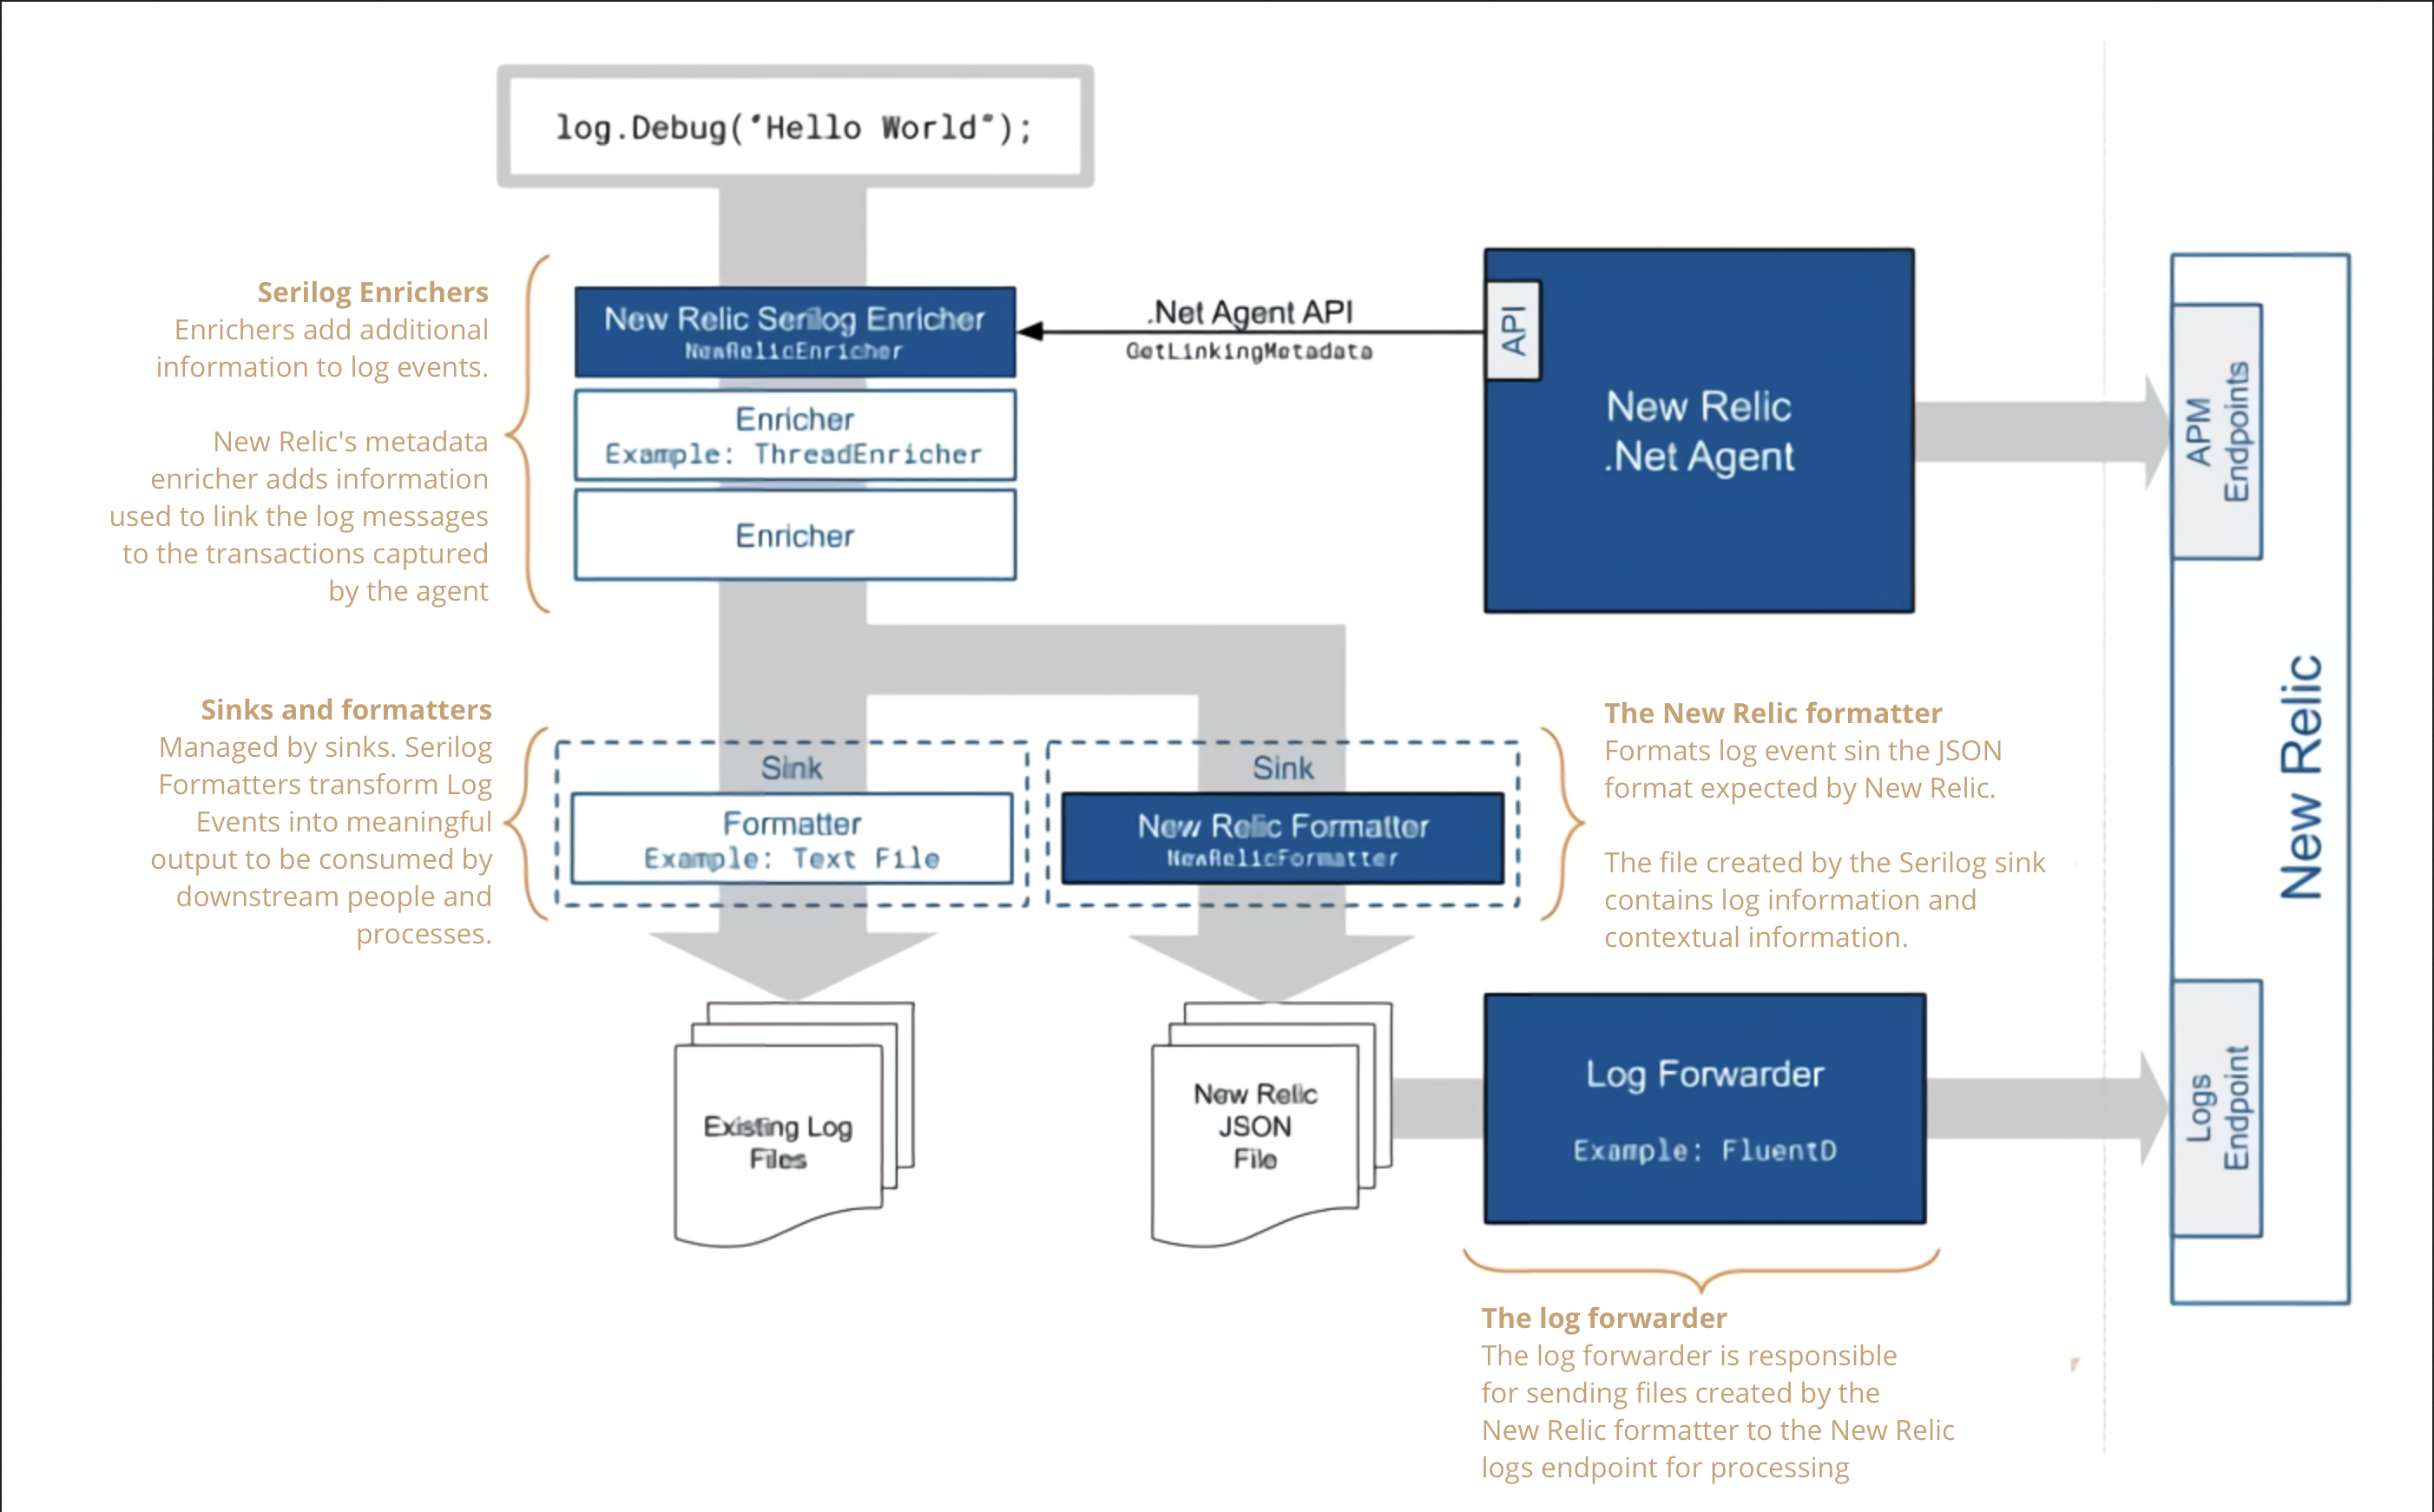
Configure Serilog 2.5 or higher extension
You can use our Serilog extension to link to your log data with related data across the rest of the New Relic platform. This requires:


