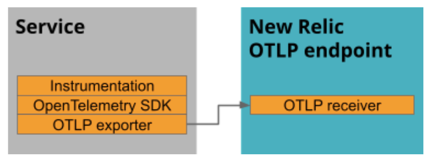
OpenTelemetry is a flexible toolkit that you can implement in a variety of ways. We recommend a basic five-step approach for setting up OpenTelemetry with New Relic. Here's an overview of the process, followed by details for each step.
- Prerequisites
- Instrument your service with OpenTelemetry
- Review configurations for exporting telemetry data to New Relic
- Complete the export configuration steps
- View your data in the New Relic UI
Step 1: Prerequisites
First things first:
- If you haven't already done so, sign up for a free New Relic account.
- Get the license key for the New Relic account to which you want to report data.
Step 2: Instrument your service with OpenTelemetry
To get started, you instrument your service with OpenTelemetry. OpenTelemetry has language-specific products and SDKs to help you. Many languages offer out-the-box instrumentation for common libraries and frameworks. Each language also provides an API for further instrumenting your service manually.
Go to the repository for your language and follow the instructions to instrument your service. When you're done, return here to complete Step 3: Review configurations for exporting telemetry data to New Relic.
- C++
- Erlang
- Go
- Java
- Javascript/Node.js
- .NET
- PHP
- Python
- Ruby
- Rust
- Swift
- ...See a complete list of languages in GitHub
Step 3: Review configurations for exporting telemetry data to New Relic
Before you set up the export of your telemetry data, you first need to review and bookmark this section of settings for New Relic. You'll need this information when you later go to other pages explaining the export steps.
The export relies on the OpenTelemetry Protocol, or OTLP for short, which is a general purpose telemetry data delivery protocol designed for the OpenTelemetry project. This protocol describes how to encode and transmit telemetry data, which makes it a natural choice for data transport. Each language SDK provides an OTLP exporter you can configure to export data over OTLP.
You have two choices for exporting data to New Relic via OTLP:
Directly from your app:

The OTLP exporter in your service can export directly to the New Relic OTLP receiver.
Export from an OpenTelemetry collector:

You can set up the collector as a gateway that receives, processes, and exports to the New Relic OTLP receiver. Alternatively, you can set up the collector as an agent that runs with your application or runs on the same host.
Whether you export directly from your app or from a collector, you'll need to:
- Be ready to configure the OTLP exporter to add a header (
api-key). The value is the license key for the New Relic account you want to send data to. - Based on your integration, be ready configure the endpoint where the exporter sends data to New Relic. Endpoints are region-specific, so use the one according to where your account is based. For example, use an EU endpoint if your account is based in Europe. Use the table below as a guide, and see the additional considerations about ports and endpoints that follow:
Integration | gRPC | HTTP | Endpoint | Supported Ports | API header name | API header value | TLS encryption required |
|---|---|---|---|---|---|---|---|
US OTLP | ✅ | ✅ |
|
|
| License key | ✅ |
EU OTLP | ✅ | ✅ |
|
|
| License key | ✅ |
US FedRAMP OTLP | ✅ | ❌ |
|
|
| License key | ✅ |
Infinite Tracing | ✅ | ❌ |
|
|
| License key | ✅ |
Important
In Node.js, the opentelemetry-collector-exporter-grpc library requires additional options to enable TLS.
Step 4: Complete the export configuration steps
Now that you are familiar with the New Relic-specific configurations for exporting, follow the instructions for the way you want to export data:
Export directly to New Relic from your apps
Click on the link below for your language and complete the configuration steps. When you're done, return here to complete Step 5. View your data in the New Relic UI.
- C++
- Erlang
- Go
- Java
- Javascript/Node.js
- .NET
- PHP
- Python
- Ruby
- Rust
- Swift
- ...Find additional OTLP language support in GitHub
Export to New Relic from a collector
You can set up the collector in different ways and for different purposes. If you need general information about the collector before getting into the setup, see our introduction.
Choose one of the following to see examples for setting up your collector to export.
- Basic collector example with Docker
- Collector setup for infrastructure host monitoring
- Additional collector setup examples
Step 5: View your data in the New Relic UI
Once you’ve instrumented your service and configured it to export its data to New Relic, watch the New Relic One UI for your traces, metrics, and logs.
The UI for OpenTelemetry has some similarities to the APM agent UI, so if you are familiar with that, you can go right to the UI. If you need help understanding your OpenTelemetry UI options or how to make sure your data appears in the UI, see View your OpenTelemetry data in New Relic.
Unsupported specifications
New Relic currently supports opentelemetry-specification v1.8.0 with a few exceptions:
- Successful responses from New Relic have no response body, instead of a Protobuf-encoded response based on the data type. New Relic also responds with success after authenticating, before decoding and validation.
- Failure responses from New Relic do not include
Status.messageorStatus.details, since OTLP clients don't use theStatusobject. - JSON-encoded Protobuf messages are not yet supported.
What's next?
After you do your initial setup, check out our best-practices guide for tips to improve your use of OpenTelemetry and New Relic.