After you import OpenTelemetry data into New Relic, you can use a variety of tools to analyze it. Take a look at these UI options:
Explorer: Get the big picture along with the details
The New Relic Explorer tab is a good place to start gathering information about your services. It offers you a way to filter services and then filter the data to show a variety of views into your data.
Find your service (entity)
To get started in Explorer, you need to find your service:
Go to one.newrelic.com.
In the left sidebar, click Services - OpenTelemetry:
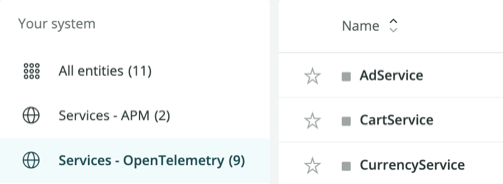
In the center pane, click the service you want to know more about, or find your service by entering the name in the top filter bar.
Narrow down your data with filters
Once you have your entity, you can then filter for data from your service.
With the filter bar Narrow data to..., you can highlight a specific facet of the telemetry recorded for your service. For example, you may want to see the error rate for a particular version of the service that you've deployed in a canary instance, so you add a filter for service.version='1.2.3'.
Filters are preserved when navigating between different views of your data for a service. For example, the filter for service.version='1.2.3' carries over to the Transactions view, so that you would see telemetry on requests to the endpoints (transactions) that are running version 1.2.3 of your service, and not any other versions.
Filters are preserved when navigating between the Summary, Transactions, Databases, Externals, Errors, and JVMs views.
Filters are also preserved when navigating to the Distributed tracing view, but with limitations. Only filter conditions that use the equals operator ("=") are currently supported when navigating to Distributed tracing. If you navigate back from the Distributed tracing page, the filters you selected on the previous view will come back.
Once you filter your data, the UI has various views in the left-navigation pane. See our descriptions below for view details.
Summary page
After you click on a service in the Explorer tab, you see the Summary page listing various golden signals about your entity. Golden signals are key monitoring details such as response time, throughput, and error rate. By using this information, you can quickly decide if you need to dig deeper.
For your data to appear in this section, make sure it has the following:
UI area | Attribute |
|---|---|
Response time |
|
Throughput |
|
Error rate |
|
Service instances pane |
|
Distributed tracing
In Distributed tracing, you can locate traces and examine span details. For your trace data to appear in the New Relic UI, it needs to conform to the OpenTelemetry trace semantic conventions. Also, in the Traces section of our best practices guide, you can find some tips about making sure your traces and spans appear in New Relic.
The following attributes are typically not added explicitly to spans. Rather, they are usually set when creating a span or performing operations (for example, recording an error) on a span using the OpenTelemetry SDK.
Attribute | Description |
|---|---|
name | A span’s name is generally set when starting a span. The name can generally be anything, but the OpenTelemetry specification provides guidance for certain types of spans like Database spans or HTTP spans. |
A span’s kind is generally set when starting a span. New Relic uses | |
otel.status_code |
|
Find traces and their associated spans
Here are some ways to target your searches:
- To find the traces you want, you can run queries like these in the filter bar:
service.name = YOUR_SERVICE_NAMEtrace.id = YOUR_TRACE_ID
- When you find an interesting trace, click on it to display a waterfall diagram showing the spans of the trace.
- Click on specific spans within the trace to display span details in the right panel.
Tip
For more ways to filter traces, see our distributed tracing UI page.
View spans with errors
After you click on a span in the trace waterfall view, you can see span errors in the right panel under Error details.
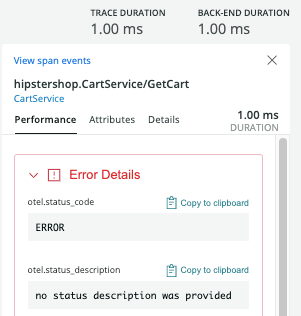
The error details are populated by spans containing otel.status_code = ERROR and display the content of otel.status_description.
To narrow your search for spans with errors, you can enter otel.status_code = ERROR directly in the distributed tracing filter bar.
View span events
If you send span events as described by the OpenTelemetry specification, you can view them in the New Relic UI. Span events have two general types:
- Exceptions
- Non-exceptions (for example, logs)
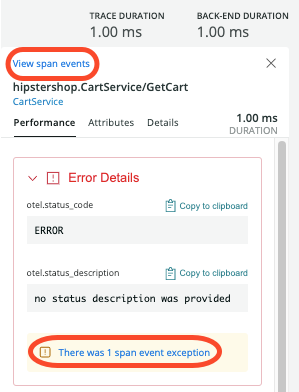
If you have span events, links for these appear in the right pane:
Click on a span in the waterfall view.
In the right pane, click View span events, or you can expand Error details and click the link at the bottom of the errors.
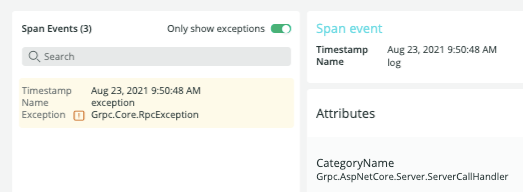
When you're in span events and only want to view exceptions, slide the toggle Only show exceptions.
Tip
OpenTelemetry exceptions handled by the app/service are displayed independently of span error status and are not necessarily associated with a span error status.
Databases
The Databases page shows an application's database and cache data. The page shows individual database transactions as a sortable table, and shows operations, throughput, and response time as charts.
For your data to appear in this section, make sure it has the following:
UI area | Attribute |
|---|---|
Top database calls |
|
Top databases (by query time) |
|
Top databases (by throughput) |
|
Errors
On the Errors page, you can see total errors as well as charts showing error count and error rate.
For your data to appear in this section, make sure it has the following:
span.kind = serverorconsumerotel.status_code = ERROR- Facets by span name
External services
The external services feature captures calls to out-of-process services such as web services, resources in the cloud, and other network entities.
For your data to appear in this section, make sure it has the following:
span.kind = clientorproducerdb.systemis not present
For more details, see External services.
JVMs
The JVMs page for services instrumented with OpenTelemetry allows you to identify which service instances have unusual or unhealthy performance patterns. You can choose several service instances to compare based on summaries of key metrics: response time, throughput, error rate, garbage collection time, and memory usage. Then, you can compare all those instances' JVM metrics collected by OpenTelemetry instrumentation using timeseries charts to spot problems.
Here's a typical workflow:
- Click JVMs.
- Find interesting JVMs using the table of summarized health metrics:
- Use the filter bar to narrow down your search.
- Sort to find outliers.
- Select those interesting JVMs.
- Click Compare to see a display of the health and runtime metrics faceted by JVM.
Review these additional topics about using the JVMs page:
Logs
The Logs page displays logs from your application. For more information about how to associate log data to your application in New Relic, see our OpenTelemetry and logging documentation.
For your data to appear in this section, make sure it has the following:
service.name- To correlate with trace data, the logs should contain the
trace.idandspan.idattributes.
Metrics explorer
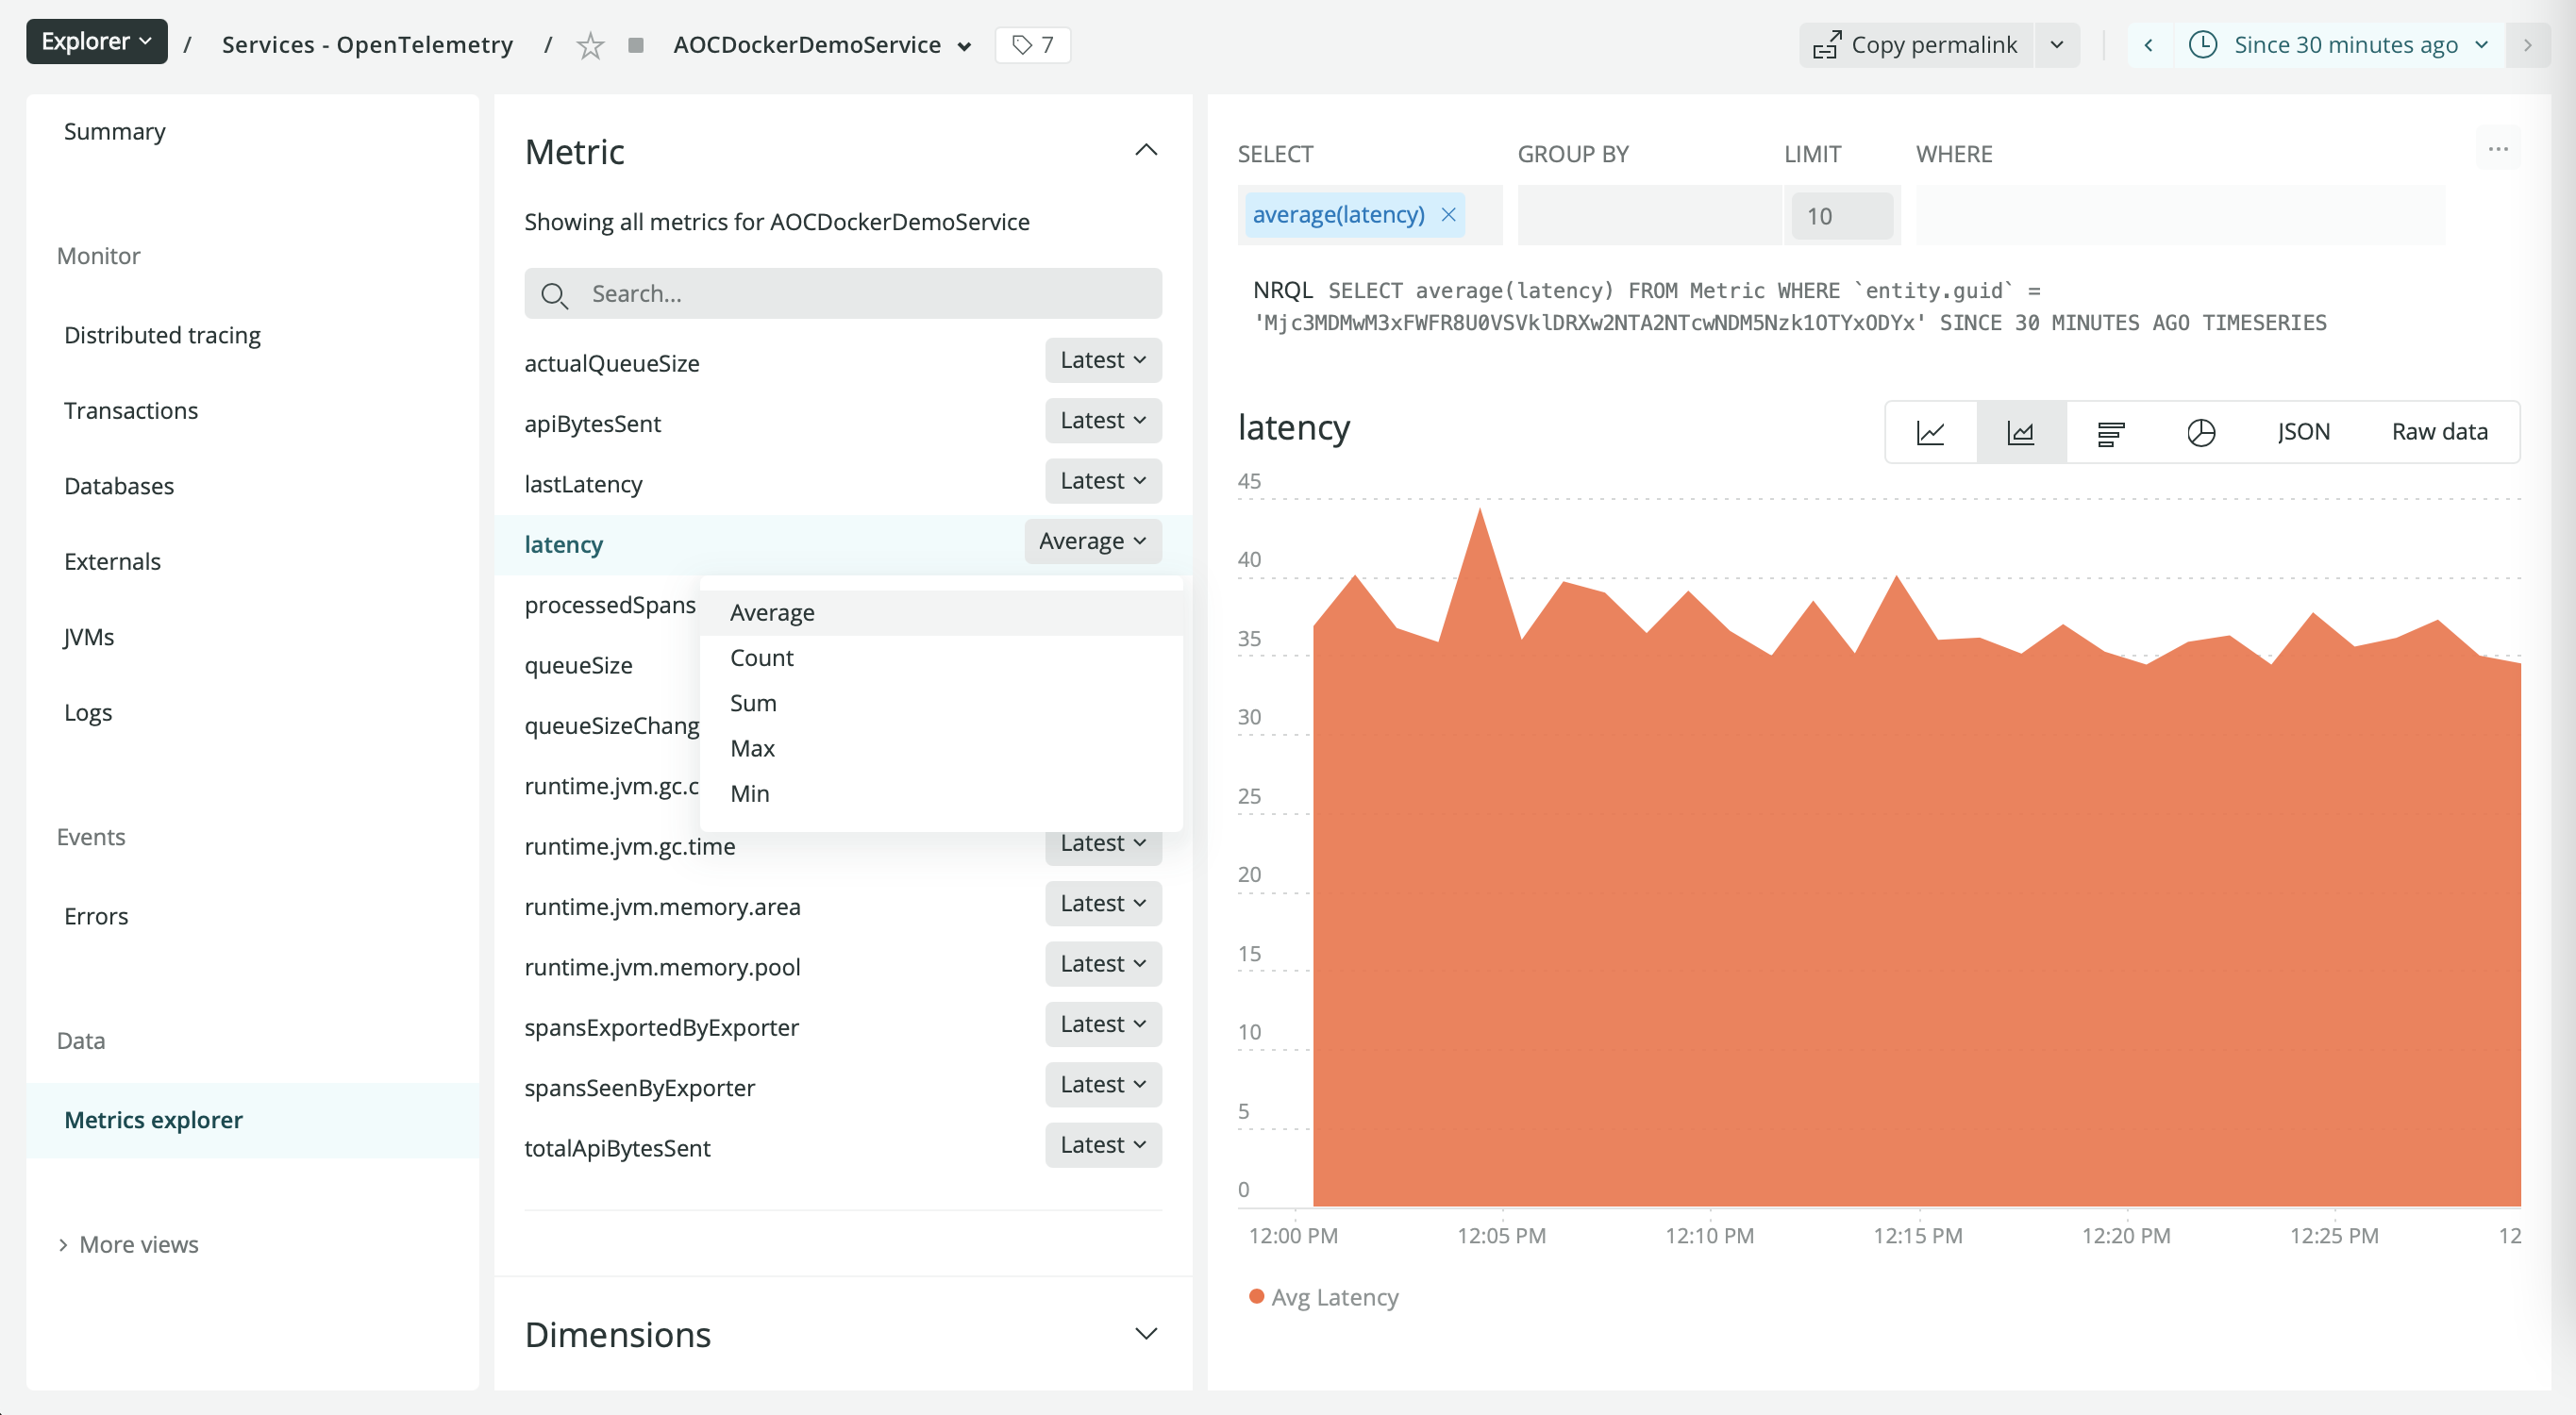
For selected OpenTelemetry languages, you can see information about your metrics in this section. Also, if you are using the Prometheus exporter with OpenTelemetry, you can view your metric data here.
Transactions
Use Transactions to identify slow or error transactions that might be causing a spike in your application's response time. To get a list of transactions: From the Transaction Summary page, select the transactions table.
New Relic's notion of a transaction encapsulates one logical unit of work in a software application - generally, this is work performed by a single process.
With OpenTelemetry, we rely on SpanKind for mapping trace data to New Relic's concept of a transaction. A SpanKind of server or consumer is used to identify the entry point of a process - that is, these are spans that are either root spans or child spans of a remote process.
For your data to appear in this section, make sure it has the following:
UI area | Description |
|---|---|
Top Transactions |
|
Throughput |
|
Data explorer and query builder
Explore your metrics and traces using the data explorer, or write your own queries in query builder using NRQL. For more on how to query your data once it's in New Relic, see Query your data and Introduction to NRQL.